
Chart view: why a short makes sense
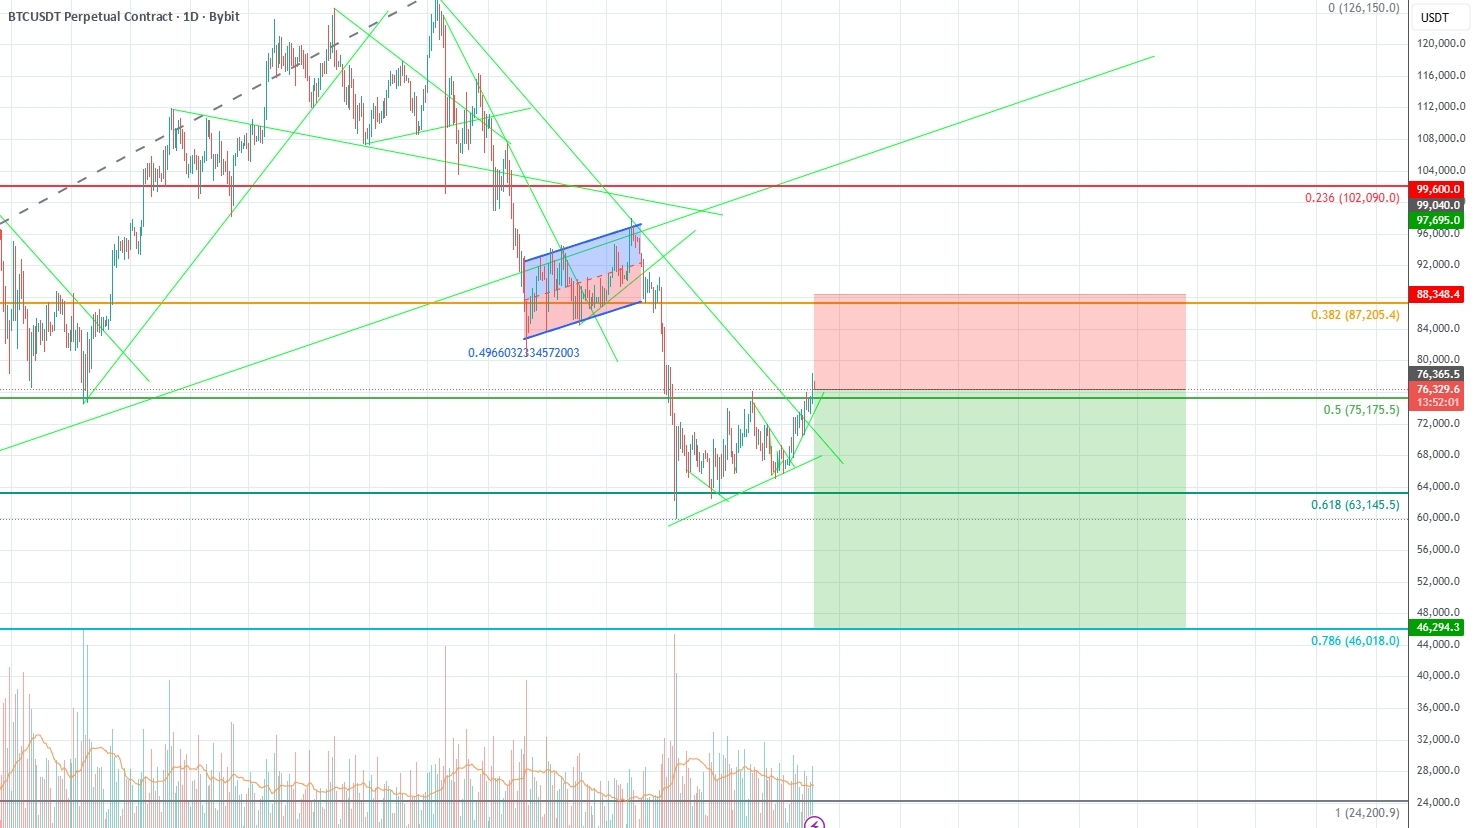
The screenshot shows several bearish signals:
Higher-timeframe downtrend: lower highs and a strong prior move down.
The blue rising channel was broken to the downside, which is often a trend-failure signal.
That was followed by a sharp selloff into the 63,145 area.
The current rebound is moving into a green descending resistance structure.
The zone around 75,175–76,335 looks like a major resistance area:
0.5 Fibonacci at 75,175
current price area around 76,335
overlap with a falling trendline
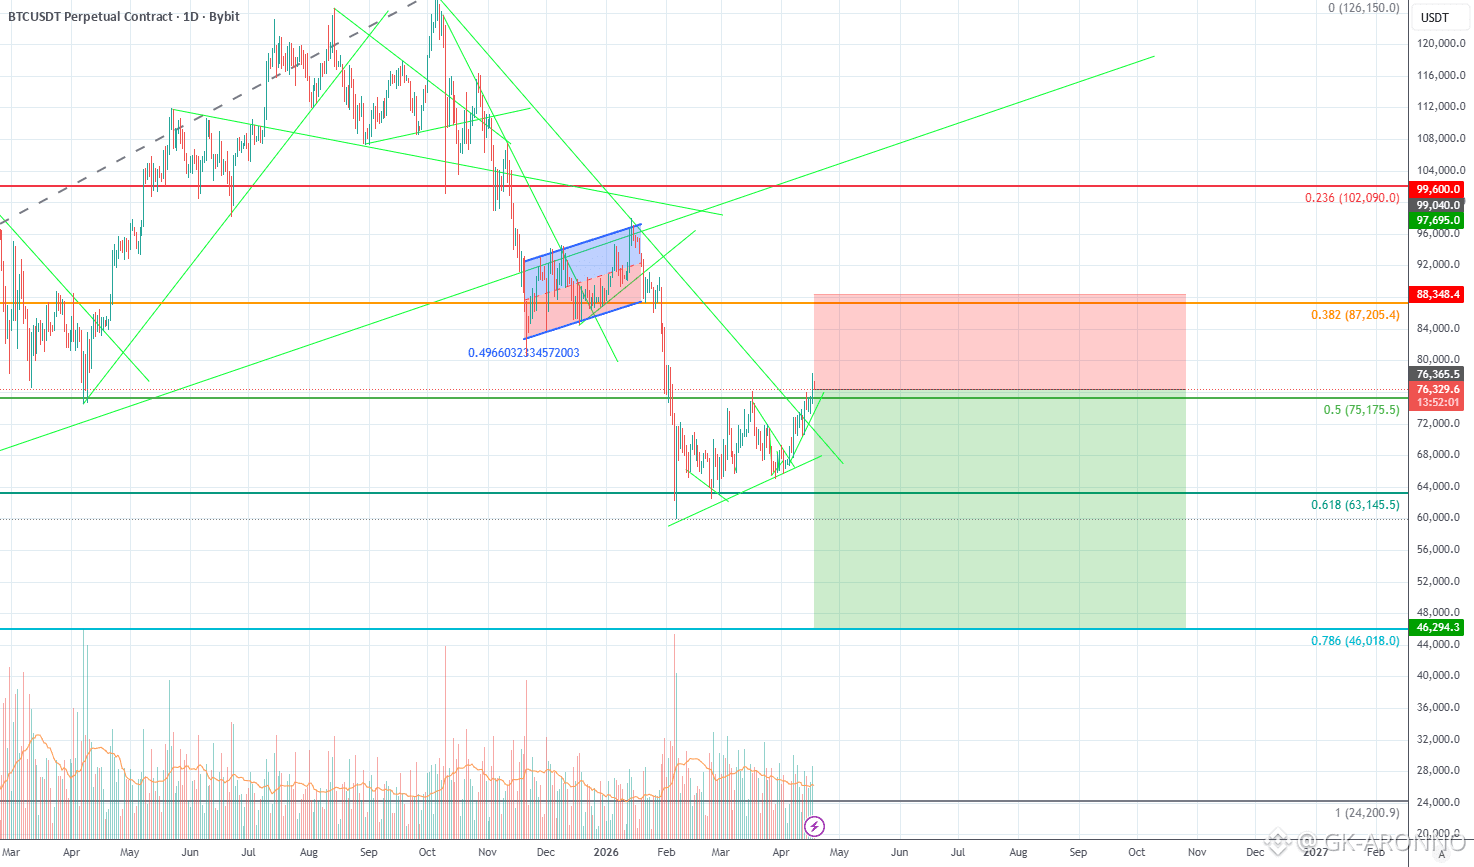
That supports the idea of:
relief rally into resistance → rejection → continuation lower
Short setup
Key short zone
The most interesting short area on this chart is:
75,000–76,500
This zone combines multiple resistance factors.
If price fails to break through cleanly, it becomes a strong rejection area for a short position.
What would confirm the short
The short becomes much cleaner if one of these happens:
A clear rejection candle / rejection move in the 75k–76.5k zone
A move back below 75,175
A break of the short-term rising structure of the current rebound
That would suggest the bounce was only a bearish retest, not a true trend reversal.
Invalidation / stop-loss
The short idea becomes weaker if price:
breaks cleanly above 76.5k / 77k
and especially if it reclaims the falling green trendline with strength
A reasonable technical invalidation zone would be roughly:
above 77.5k to 79k, depending on how tight or conservative the stop should be
Downside targets
Target 1
72k–70k
first reaction / partial take-profit zone
Target 2
68k–63,145
very important support area
strong reaction is likely there
Target 3
60k–56k
if 63,145 breaks decisively, the chart opens much more to the downside
Main extended target
46,018 (0.786 Fibonacci)
From the chart, this is a logical larger bearish target, but only if one condition is met:
The 63,145 support must break clearly.
As long as 63k holds, 46k remains only an extended bearish scenario, not a confirmed target.
Conclusion
A short toward 46,000 is technically possible because:
the main trend is bearish,
the current rebound is running into resistance,
and the structure looks similar to a bear flag / relief bounce inside a larger downtrend
But the key point is:
the short trigger is in the 75k–76.5k area
46k only becomes realistic if 63,145 breaks
before that, the more important downside levels are 72k, 68k, and 63k
Practical trade logic from this chart
Bearish scenario:
rejection at 75k–76.5k
move back below 75,175
then possible targets:
72k
68k
63,145
if that breaks: 56k → 46k
The short idea is invalidated:
if price holds and breaks above 77k+...
