


You don’t need months to understand candlesticks.
I’ll make it simple so you can start reading charts like a pro today.
First, understand this every candle tells a story.
It shows you the fight between buyers (bulls) and sellers (bears).
A candle has 3 main parts:
The body (price movement), and the wicks (rejections).
If the candle is green, buyers are in control.
If it’s red, sellers are in control.
But that’s just the surface.
What really matters is how the candle closes.
I always focus on strong closes. A big green candle closing near the top means buyers are confident. A long wick at the top means price got rejected sellers stepped in.
Now let me show you what actually gives you an edge.
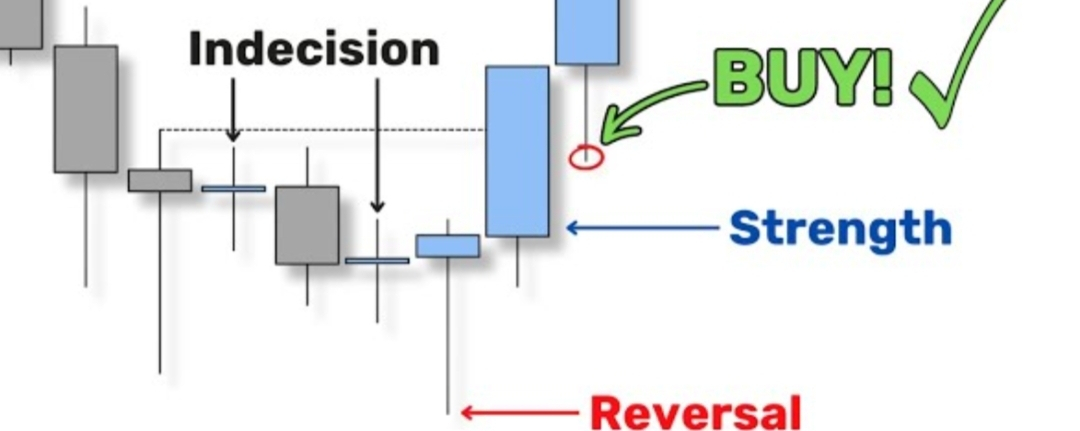
When I see small candles after a big move, I know the market is slowing down. That’s where reversals often start.
When I see a strong breakout candle with high momentum, I know smart money is entering.
And when I see repeated rejection wicks at the same level, I know that area is important support or resistance.
You don’t need 50 patterns. You just need to read behavior.
Here are the only patterns I actually use:
Hammer price drops but gets pushed back up. I see buyers stepping in.
Shooting Star price goes up but gets rejected. I see sellers taking control.
Engulfing Candle one strong candle takes over the previous one. That’s momentum shift.
That’s it. Simple.
I don’t overcomplicate charts. I watch how price reacts.
If you combine this with patience, you’ll already be ahead of 90% of traders.
You don’t become pro by memorizing patterns.
You become pro by understanding what the market is doing.
Start simple. Stay consistent.
And trust me once you see it, you can’t unsee it.