Bitcoin price action stayed healthy today. Bitcoin rose another 0.5% in the last 24 hours, now trading around $81,300. Over the past week, BTC is up 5.5%. The crypto community is already talking about a “bull run” and “altseason.” Some altcoins are pumping hard, including Toncoin and MemeCore (M).
But the real story of the Bitcoin price today is under the hood: whales are buying while retail is selling.
Saylor Hints at Selling Bitcoin – But Here’s the Math
MicroStrategy (now Strategy) reported a massive $12.54 billion net loss for Q1 2026, driven by Bitcoin’s price decline. New FASB accounting rules require the company to mark holdings to market each quarter.
Strategy currently holds 818,334 BTC, valued at approximately $66.4 billion.
But here’s the twist: executives signaled a shift from a strict “never sell” stance to actively managing BTC to improve bitcoin-per-share value, including potential sales to fund dividends.
The math, simplified:
Step 1: Holdings → $66.4B in BTC
Step 2: Obligations → $1.5B/year (~$125M/month)
Step 3: Coverage → $66.4B ÷ $125M = 531 months (~44 years)
Step 4: Sell pressure → $125M ÷ $66.4B = ~0.18% per month
Worried about Saylor selling $BTC? Here’s the full math, simplified: Step 1: Stack BTC • Current stash $66.4B Step 2: Obligations • $1.5B per year • $125M per month Step 3: Coverage $66.4B ÷ $125M = 531 months 44 years of coverage in BTC value Step 4: % they’d sell…
— Wise Advice (@wiseadvicesumit) May 6, 2026
What most people miss:
While potentially selling ~0.18%, Strategy also raises capital (via equity and instruments like STRC) and uses it to buy more BTC.
The real equation: Sell a tiny fraction → raise capital → buy more Bitcoin → grow BTC per share.
They are turning it into a capital engine.
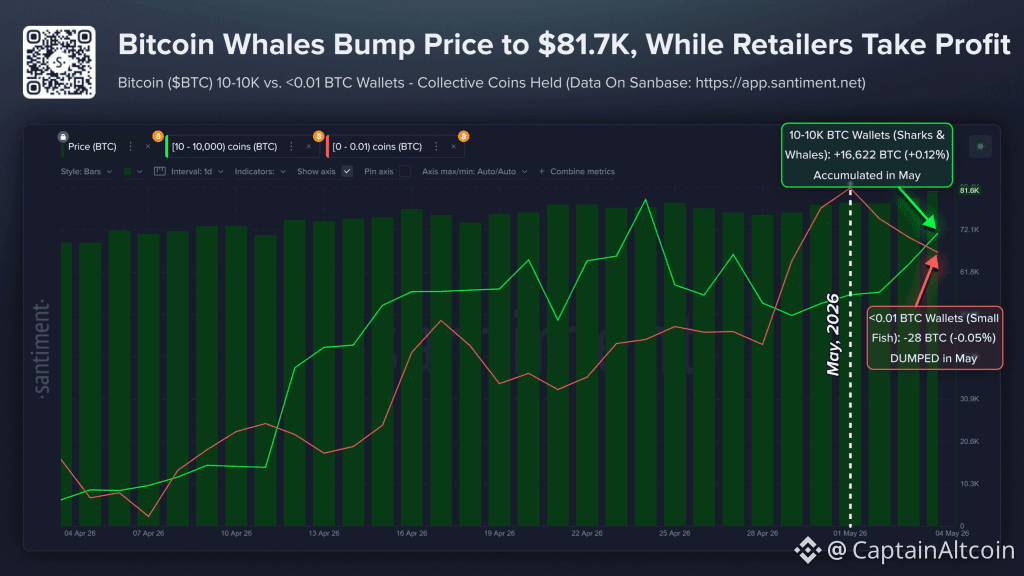
Santiment: Whales Accumulate, Retail Dumps – Classic Bull Signal
Data from Santiment shows a textbook bullish setup.
So far in May:
10–10K BTC wallets (whales & sharks): +16,622 BTC (+0.12%)
<0.01 BTC wallets (retail): -28 BTC (-0.05%)
This divergence is key. Historically, major bull runs start when smart money accumulates while retail exits.
 Source: X/@SantimentData
Chart analysis: The Santiment chart shows Bitcoin price climbing from $72K in early April to $81.6K by May 4. Whale holdings (10–10K BTC wallets) increased steadily throughout April and into May, adding +16,622 BTC. Meanwhile, small wallets (<0.01 BTC) declined slightly, selling 28 BTC. The divergence is clear: large players are buying while retail is selling.
Bitcoin Price and Chart Analysis
Let’s look at the MACD chart provided (weekly timeframe). The data shows:
Date MACD Line Signal Line Histogram Apr 9 6,800 5,000 +1,800 Apr 12 7,400 5,000 +2,400 Apr 15 7,500 5,000 +2,500 Apr 18 7,600 5,000 +2,600 Apr 21 7,800 5,000 +2,800 Apr 24 7,900 5,000 +2,900 Apr 27 7,700 5,000 +2,700 Apr 30 7,600 5,000 +2,600 May 3 8,000 5,000 +3,000
Key observations: The MACD line (blue) sits well above the signal line (red). The histogram turned positive in early April and kept expanding. By May 3, the histogram hit +3,000 – the highest reading in the table. This is a strong bullish signal on the weekly chart. Momentum is building, not fading.
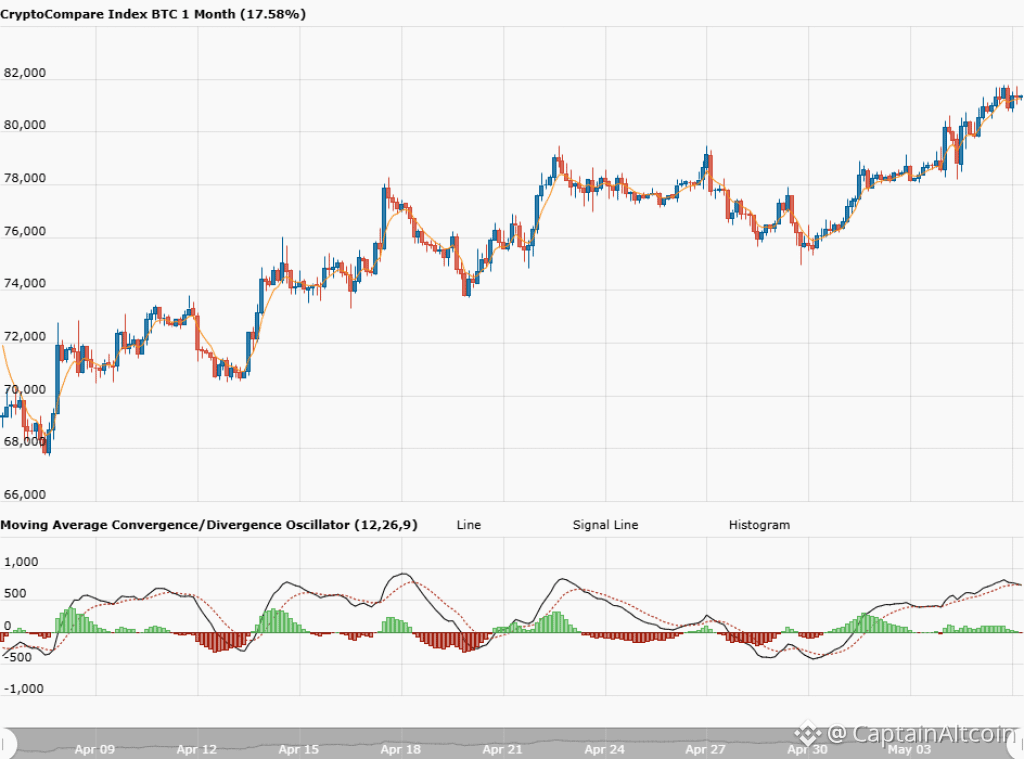 Source: CryptoCompare.com Bitcoin Price: Key Levels to Watch Type Level Notes Immediate support $80,000 Psychological round number Strong support $77,000 Previous resistance turned support Major support $75,000 50‑day MA area Immediate resistance $82,000 Local high from May 4 Key resistance $84,000 200‑day MA Major resistance 88 , 000 – 88,000–90,000 Top of the range from January
BTC broke above $80K on May 4 for the first time in three months, reached $81.7K, and pulled back slightly to $81.3K. Dips are getting bought, and the 5.5% weekly gain reflects steady accumulation.
Related BTC news: Bitcoin Price to $85K? Analyst Calls It ‘FUD’
Bitcoin Price Scenarios
Bullish
BTC breaks $82K, then tests $84K (200 MA).
A weekly close above $84K opens the move toward $88K–$90K.
Whale accumulation continues.
Bearish
Rejection at $82K. MACD histogram starts shrinking.
Loss of $80K leads to $77K, then potentially $75K.
Retail panic could accelerate downside.
Most Likely
Range between $80K–$82K short term.
MACD is bullish, but $84K remains a major wall.
Expect choppy price action until a catalyst appears.
Overall, whales accumulated 16,622 BTC in May while retail sold. Strategy may sell just 0.18% monthly, but continues accumulating through capital inflows. Weekly MACD is strongly bullish.
Bitcoin sits at $81.3K, up 5.5% on the week, but the 200-day MA near $84K is the level that decides the next major move.
FAQs
Why is Bitcoin price up today
Whale accumulation and positive MACD momentum pushed BTC higher. Retail selling got absorbed by larger players.
Is Strategy selling Bitcoin
Yes, but only 0.18% monthly to fund dividends. They raise more capital and buy significantly more BTC. Net holdings still grow.
What will $1 of Bitcoin be worth in 2030
If Bitcoin reaches the widely predicted range of $300,000 to $1.5 million by 2030, your $1 investment today could be worth roughly between $4.50 and $22.50. This is based on aggressive long-term projections from major firms like Ark Invest and Standard Chartered, driven by expected institutional adoption, supply shocks from halving events, and growing mainstream use.
Subscribe to our YouTube channel for daily crypto updates, market insights, and expert analysis.
The post Bitcoin Price Today: Whales Accumulate 16,622 BTC in May as Strategy Hints at Selling appeared first on CaptainAltcoin.