
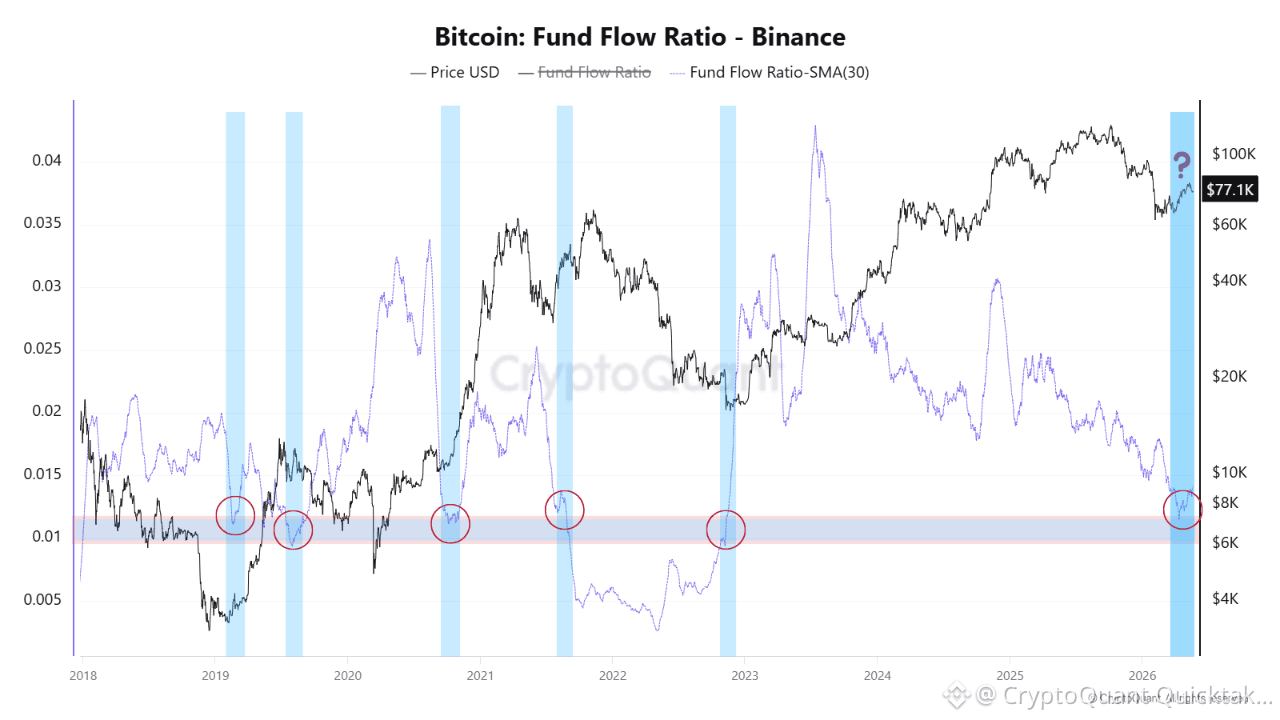
Bitcoin's Fund Flow Ratio on Binance has returned to the 0.010–0.012 zone for the sixth time since 2018, a level that has historically preceded structural turning points in price.
The Fund Flow Ratio measures the amount of BTC flowing into and out of an exchange relative to the total BTC transferred across the whole Bitcoin network. In simple terms, it tells us how relevant exchange-driven activity is compared to broader on-chain activity.
When the ratio is high, investors are actively using exchanges. This usually reflects stronger trading activity, higher speculation, increased repositioning, or potential profit-taking. When the ratio is low, exchange activity represents a smaller share of total network transfers. This can signal lower speculative participation, reduced sell-side pressure, or a market waiting for confirmation before making its next major move.
Historically, Binance’s Fund Flow Ratio has repeatedly compressed toward the 0.010–0.012 zone near important market transitions.
In early 2019, after the 2018 bear market, the ratio reached this lower band while Bitcoin was still trading near depressed levels. Exchange activity was muted, but that lack of movement was also part of the bottoming process. Sellers had already spent much of their pressure, and the market was entering a phase where supply was no longer aggressively rotating through exchanges.
A similar structure appeared in 2020, before Bitcoin’s major bull market expansion. Binance’s relative flow activity remained compressed while price was building a base. Once demand returned and price momentum accelerated, the Fund Flow Ratio expanded sharply, confirming that investors were coming back to exchanges to position, trade, and chase the new trend.
The current setup suggests that Bitcoin is approaching a decision zone: either demand remains weak and the compression reflects apathy, or sell-side exhaustion becomes the foundation for the next recovery phase.
Written by MorenoDV_