

After weeks of silence, I think we’re finally approaching a critical decision point for Bitcoin.
I don’t post for the sake of posting. I post when structure matters.
Right now, BTC is sitting at one of the most important macro levels of this cycle.
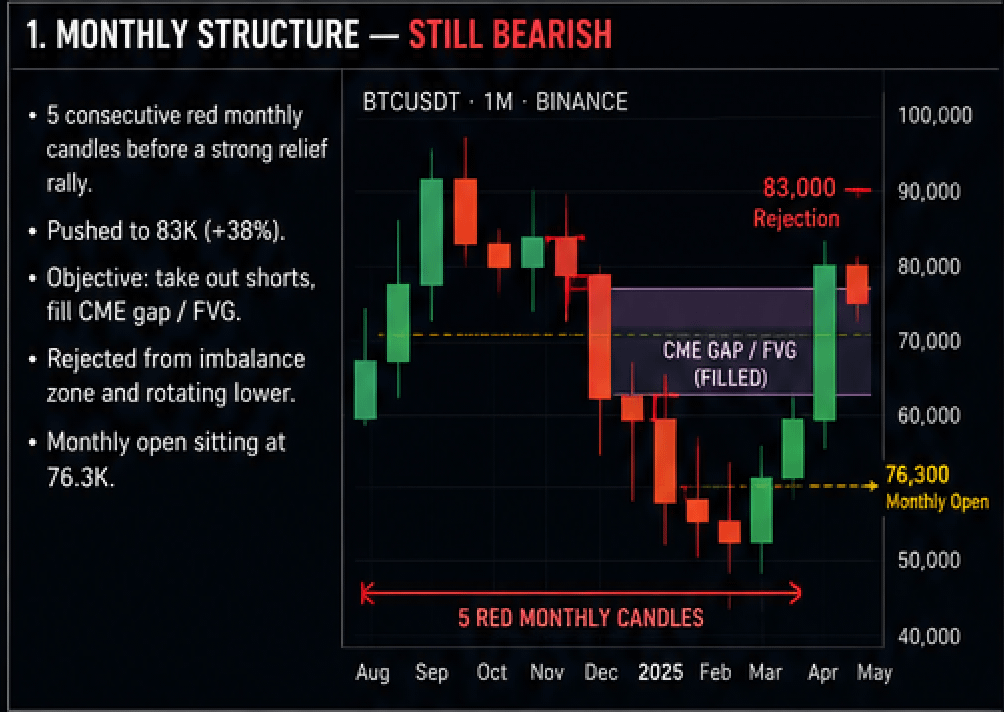
MONTHLY STRUCTURE STILL BEARISH
On the monthly timeframe, Bitcoin printed five consecutive red candles before finally producing a strong relief rally.
The move toward 83K was aggressive: +38% from the lows.
But structurally? The trend is still bearish.
The objective of the rally was clear: ➡️ take out late short positions ➡️ fill higher timeframe imbalances ➡️ tap the CME inefficiency
And that objective has largely been completed.
BTC rejected almost perfectly from the imbalance zone before rotating lower again.
Suggested chart: • Monthly BTC chart • Highlight:
5 red monthly candles
83K rejection
CME gap / FVG fill
Monthly open at 76.3K
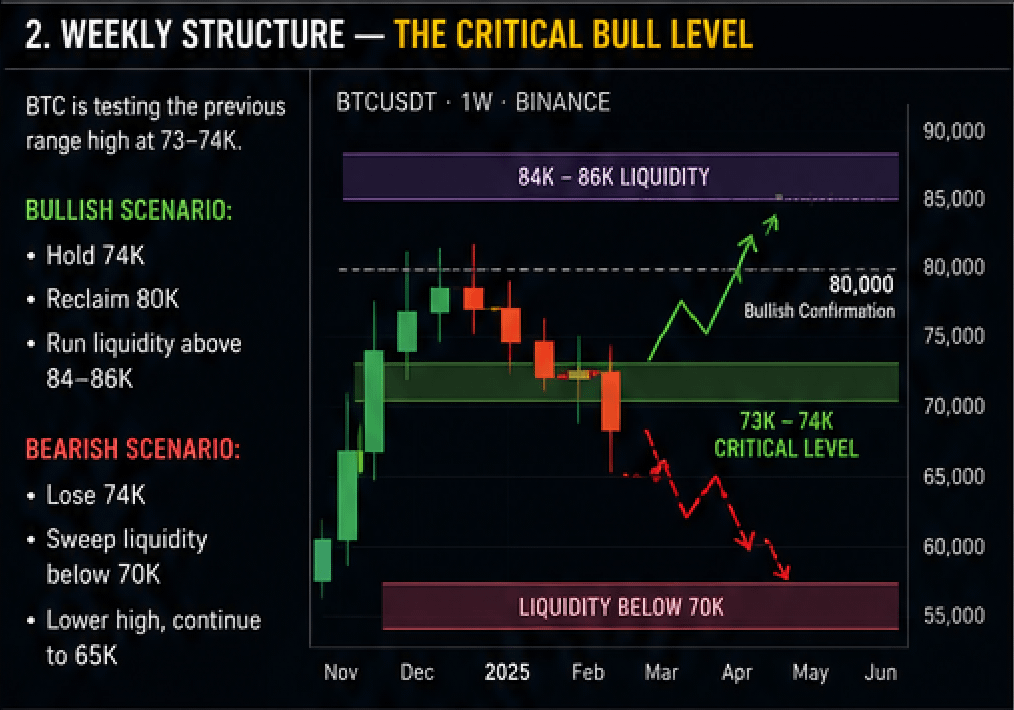
WEEKLY STRUCTURE, THE CRITICAL BULL LEVEL
Bitcoin is now testing the previous weekly range high around the 73–74K region.
This area is everything.
If bulls hold this level: ➡️ reclaim 80K ➡️ break local lower highs ➡️ run liquidity above 84–86K
But if this level fails: ➡️ liquidity below 70K becomes the target ➡️ current bounce becomes a lower high ➡️ probability increases for continuation toward 65K
Structurally, this is the defining pivot.
Suggested chart: • Weekly BTC structure • Mark:
74K support
80K confirmation level
Liquidity below 70K
Potential lower-high scenario
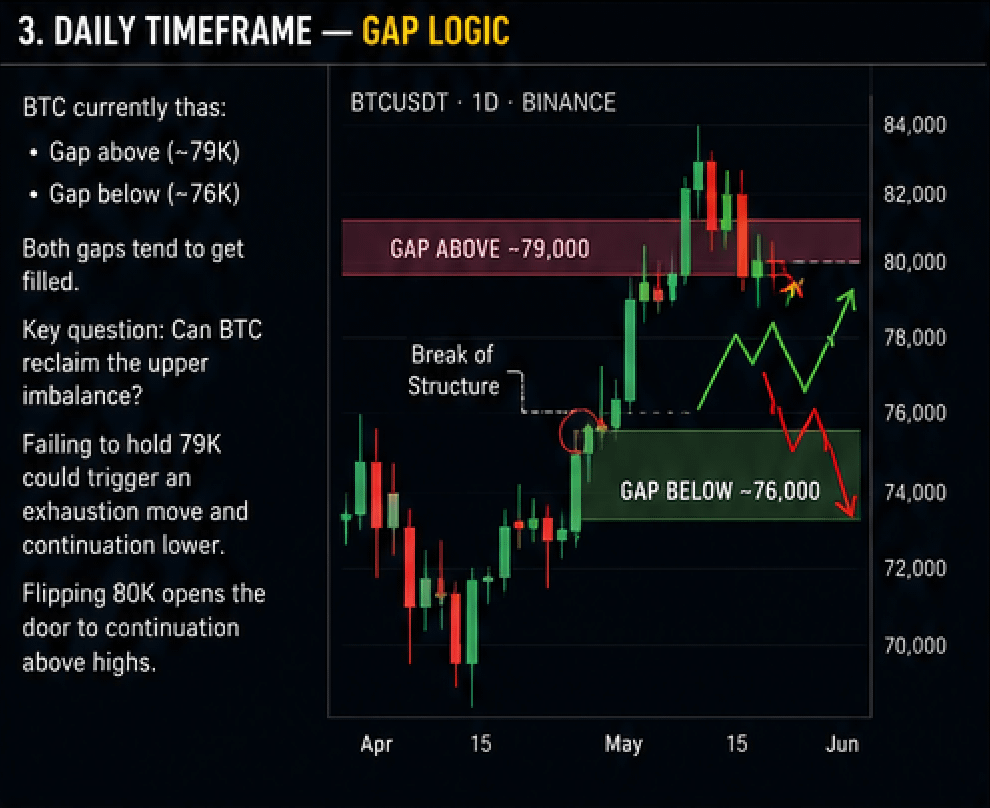
DAILY TIMEFRAME, GAP LOGIC
BTC currently has: • a gap above price (79K) • a gap below price (76K)
Historically, both tend to get filled.
The key question is: Can BTC reclaim the upper imbalance?
If price pushes into 79K but fails to hold it, that would likely confirm an exhaustion move before another leg down.
Classic market behavior: ➡️ break structure ➡️ retest failed breakout ➡️ continuation lower
But if BTC flips 80K into support, then acceptance above highs becomes possible.
Suggested chart: • Daily BTC chart • Highlight:
79K gap
76K gap
break of structure
rejection/reclaim scenarios
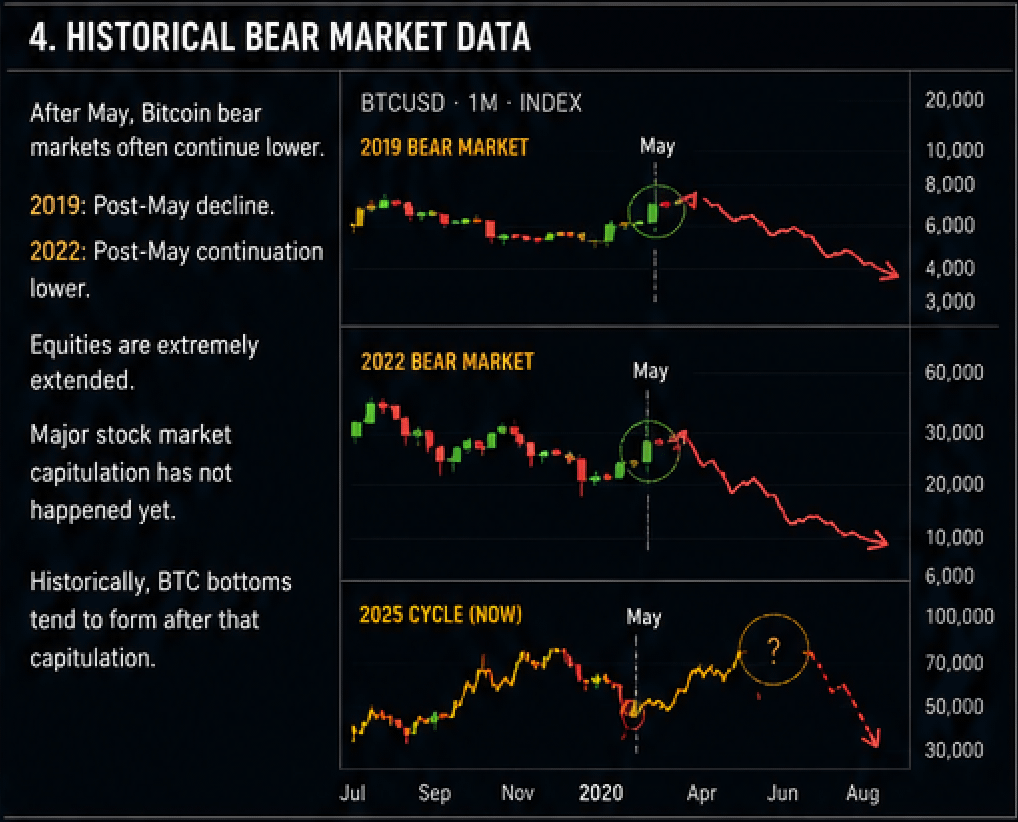
HISTORICAL BEAR MARKET DATA
One thing that stands out historically:
After May, Bitcoin bear markets often continue lower.
2019: Post-May decline.
2022: Post-May continuation lower.
This matters because equities are also extremely extended right now.
The S&P 500 and Nasdaq have gone nearly vertical.$SPY
Historically, Bitcoin bottoms tend to form after a major stock market capitulation.
And so far… that capitulation hasn’t happened yet.
Suggested chart: • Historical BTC bear cycles • Highlight post-May performance • Overlay with S&P corrections


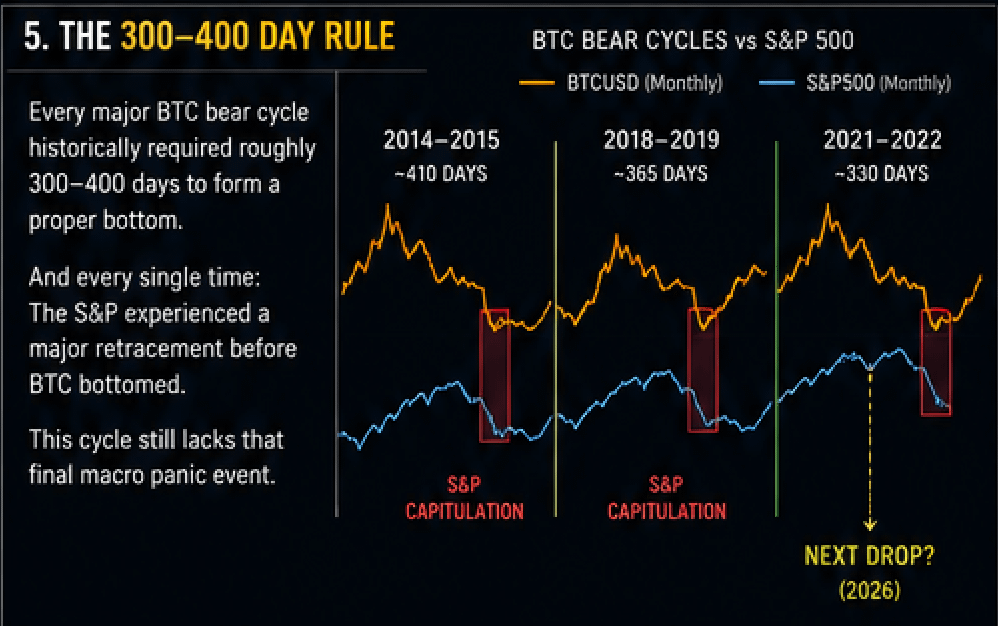
THE 300–400 DAY RULE
Every major BTC bear cycle historically required roughly: 300–400 days to form a proper bottom.
And every single time: the S&P experienced a major retracement before BTC bottomed.
This cycle still lacks that final macro panic event.
That doesn’t guarantee new lows. But historically, it suggests the market may still need one final reset before the next true bull expansion.
Suggested chart: • Timeline comparison:
BTC bear markets
S&P capitulation phases
duration to bottom
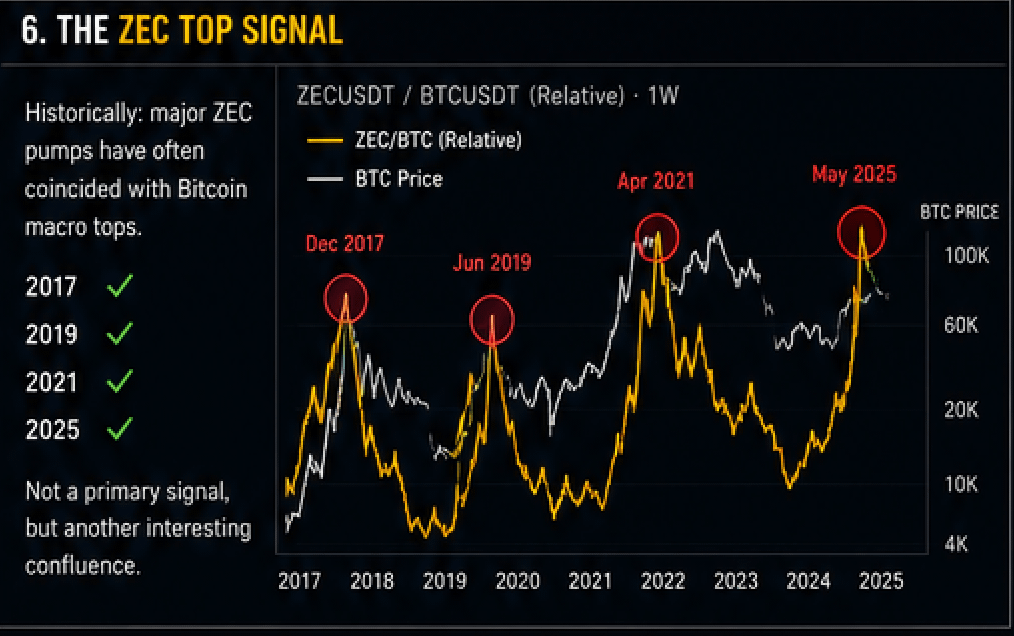
THE ZEC TOP SIGNAL
One subtle metric I continue monitoring: $ZEC relative strength.

Historically: major ZEC pumps have often coincided with Bitcoin macro tops.
2017 ✔️ 2019 ✔️ 2021 ✔️ 2025 ✔️
It’s not a primary signal. But it’s another interesting confluence suggesting that BTC may still be forming a lower high within a broader macro downtrend.
Suggested chart: • ZEC vs BTC cycle tops • Mark historical correlations
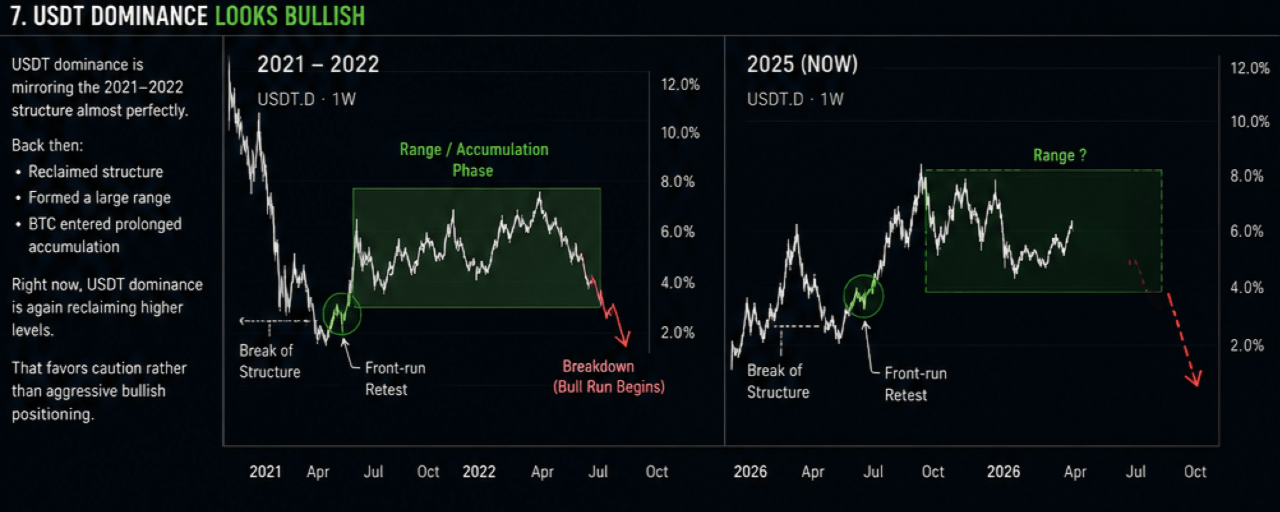
USDT DOMINANCE LOOKS BULLISH
USDT dominance is currently mirroring the 2021–2022 structure almost perfectly.
Back then: ➡️ USDT dominance reclaimed structure ➡️ formed a large range ➡️ BTC entered prolonged accumulation
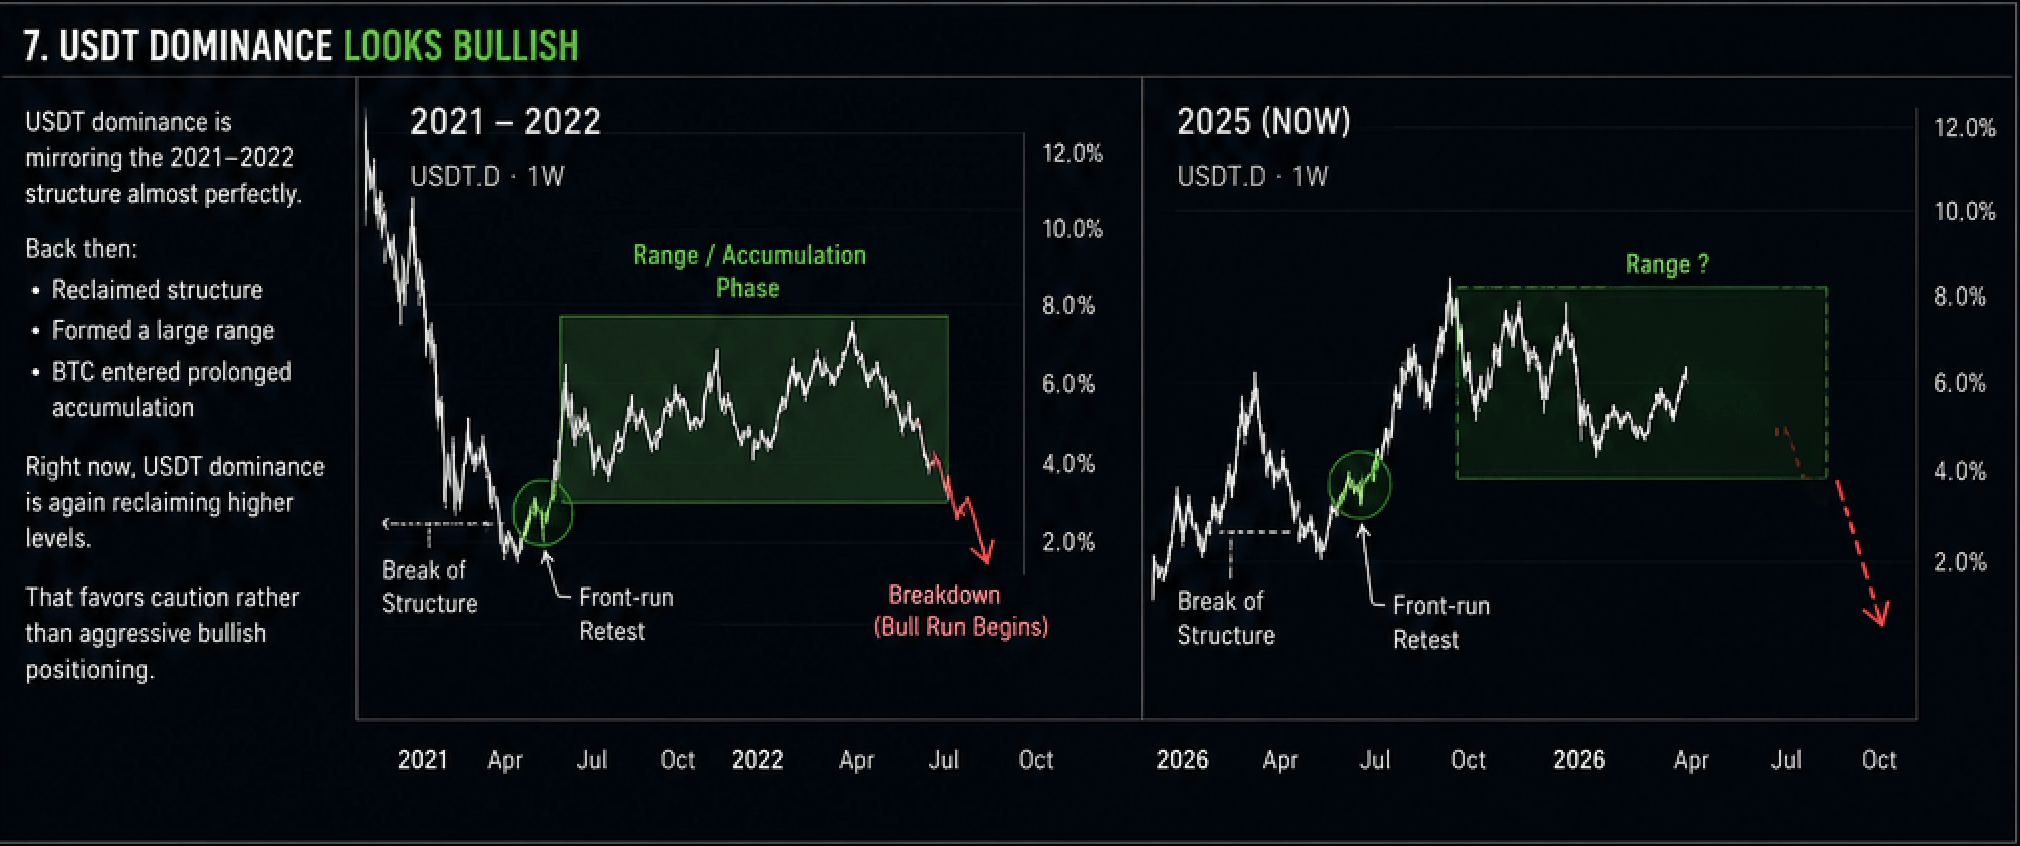
Right now, USDT dominance is again reclaiming higher levels.
And structurally, that favors caution rather than aggressive bullish positioning.
Suggested chart: • USDT Dominance chart • Compare:
2021–2022 structure
current structure
retest front-run
FINAL THOUGHTS
The market is at a major inflection point.
Bullish scenario: • Hold 74K • Flip 80K • Attack 84–86K liquidity
Bearish scenario: • Fail at imbalance reclaim • Form lower high • Sweep sub-70K liquidity
For now, this still looks more like a relief rally inside a macro bearish structure than the beginning of a new impulsive bull trend.
Patience matters here.
The next few weekly candles will likely define the direction for the rest of 2026.