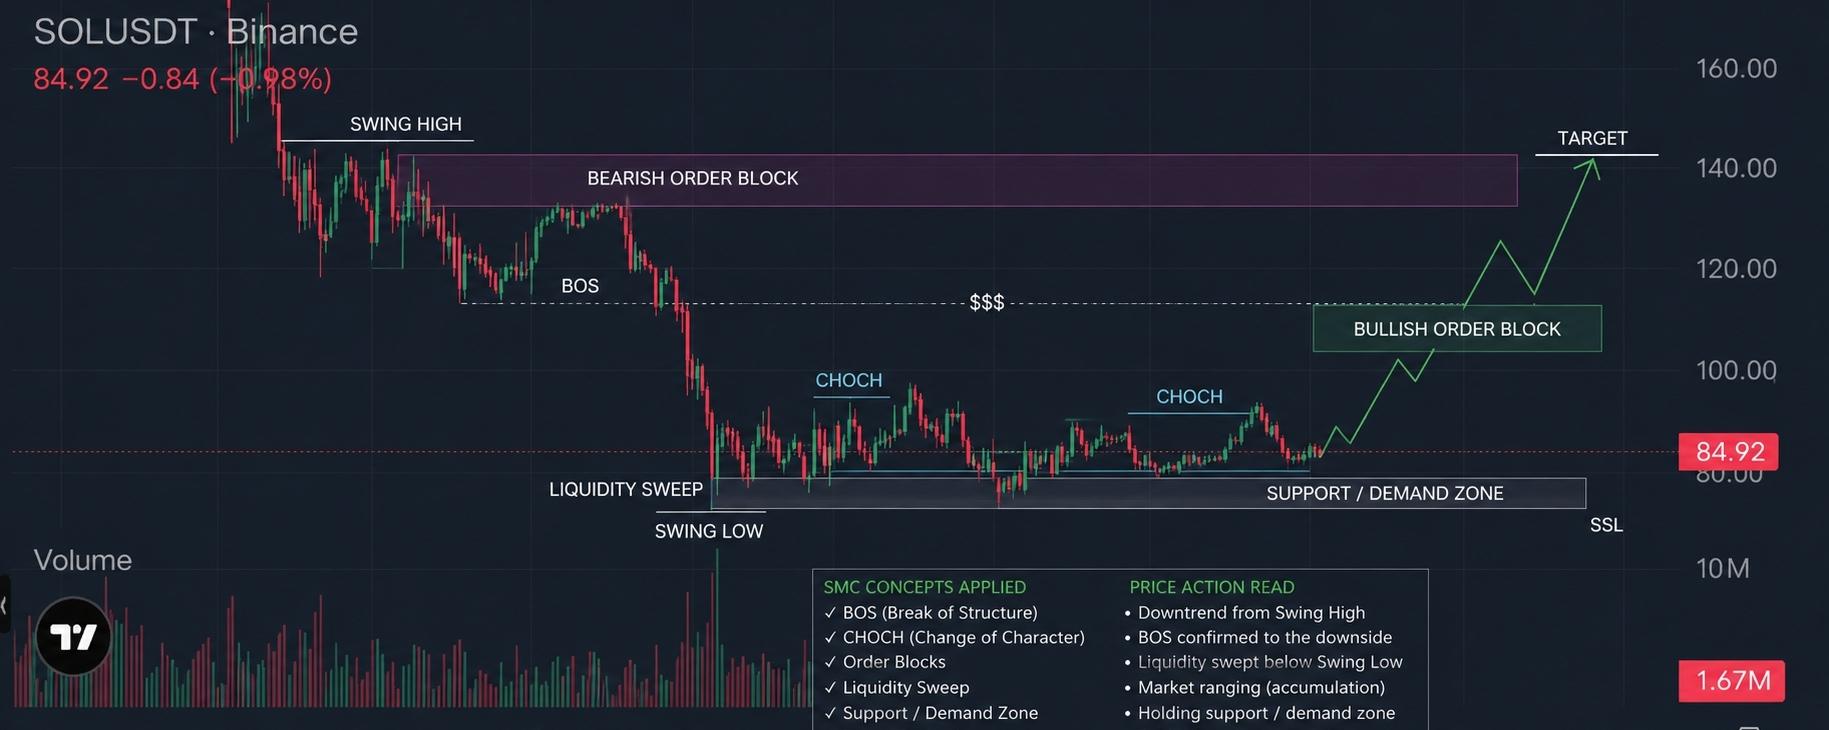
The chart of $SOL against Tether on Binance shows a complete market structure analysis using Smart Money Concepts (SMC) and traditional Price Action trading methods. This analysis helps traders understand market direction, liquidity movement, institutional behavior, and possible future targets.
The chart begins with a strong bearish trend from the top area near 160 USDT. The market continuously created lower highs and lower lows, which clearly confirmed a downtrend. In Price Action trading, this structure tells traders that sellers are dominating the market and buyers are weak. The continuous red candles and rejection from resistance zones also support the bearish momentum.
One of the first important SMC concepts visible on the chart is the Swing High. A swing high represents a major resistance area where price was rejected. After touching this area, the market failed to continue upward and sellers entered aggressively. This created a major bearish move.
After the rejection, the market formed a Bearish Order Block. In Smart Money Concepts, an order block is an area where institutional traders or “smart money” place large orders before a strong movement. The purple highlighted zone on the chart shows the bearish order block where sellers controlled the market. Whenever price revisits such areas, traders expect strong resistance and possible selling pressure again.
The chart also highlights BOS (Break of Structure). BOS happens when price breaks an important support or resistance level and confirms the continuation of a trend. Here, the market broke below previous support, confirming bearish continuation. This break gave traders confirmation that the downtrend was still active.
Later, the market created a very sharp drop toward the lower area around 75–80 USDT. This movement formed a Liquidity Sweep near the swing low. Liquidity sweeps happen when price moves below previous lows to trigger stop losses of retail traders before reversing direction. Smart money often uses this technique to collect liquidity from the market.
After the liquidity sweep, the market started moving sideways. This area is called an Accumulation Zone. The chart then shows CHOCH (Change of Character), which is an early sign that the bearish trend may be weakening. CHOCH happens when the market stops making lower lows and begins forming higher highs or stronger bullish reactions.
The highlighted gray zone near the bottom represents a Support or Demand Zone. This is the area where buyers entered repeatedly and defended the price from falling further. Price consolidation around this level suggests that institutional buying may be taking place.
The chart also projects a possible bullish movement toward higher targets. A Bullish Order Block is marked above current price levels. If price breaks resistance and maintains bullish momentum, traders may expect a rally toward the target zone around 140 USDT.