
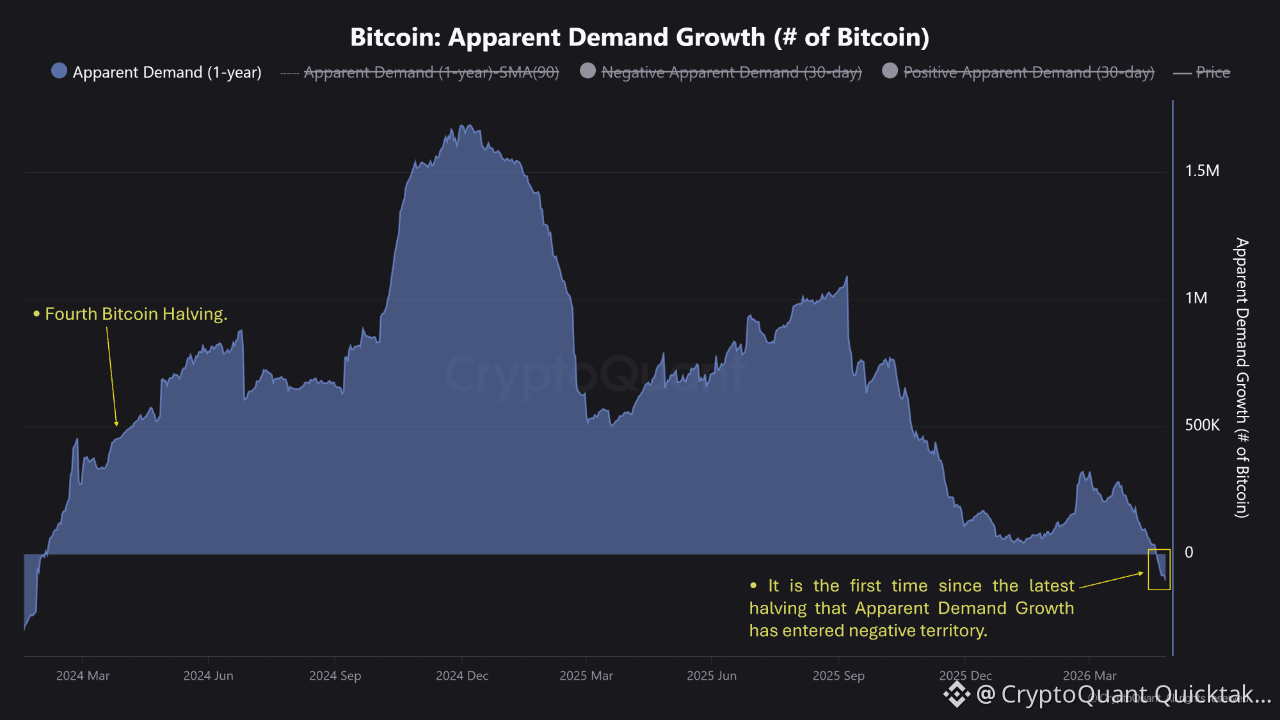
• Bitcoin demand is in a downtrend.
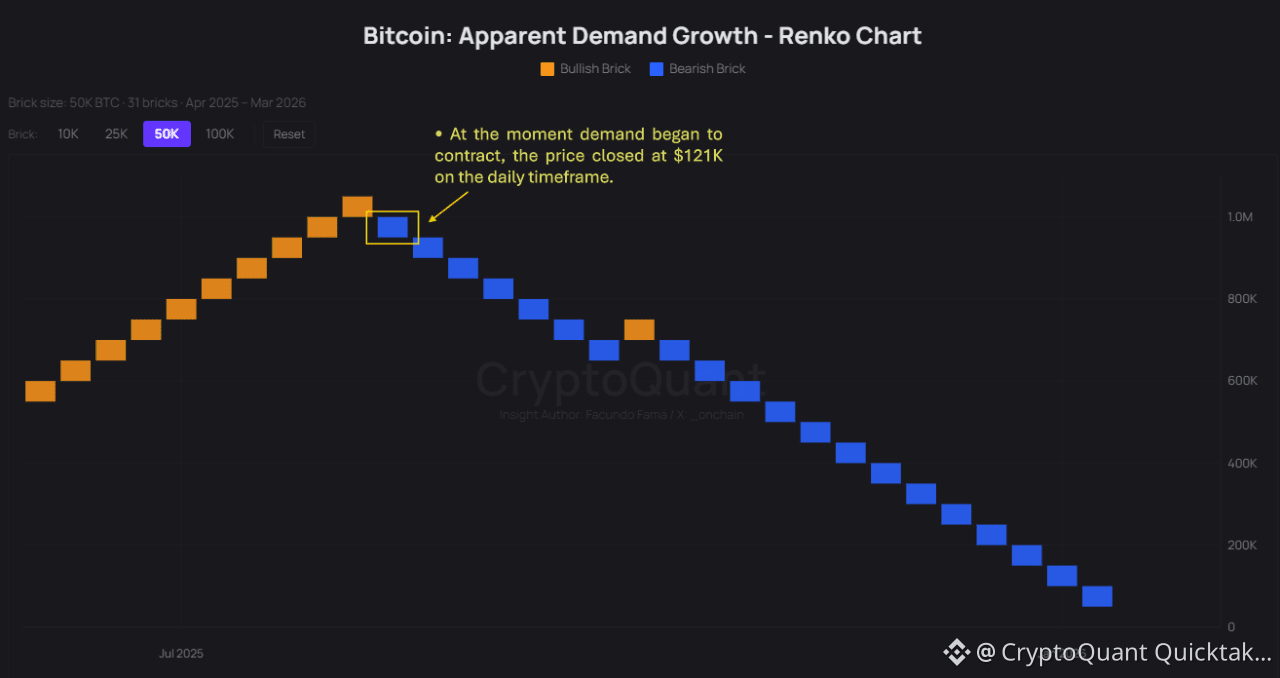
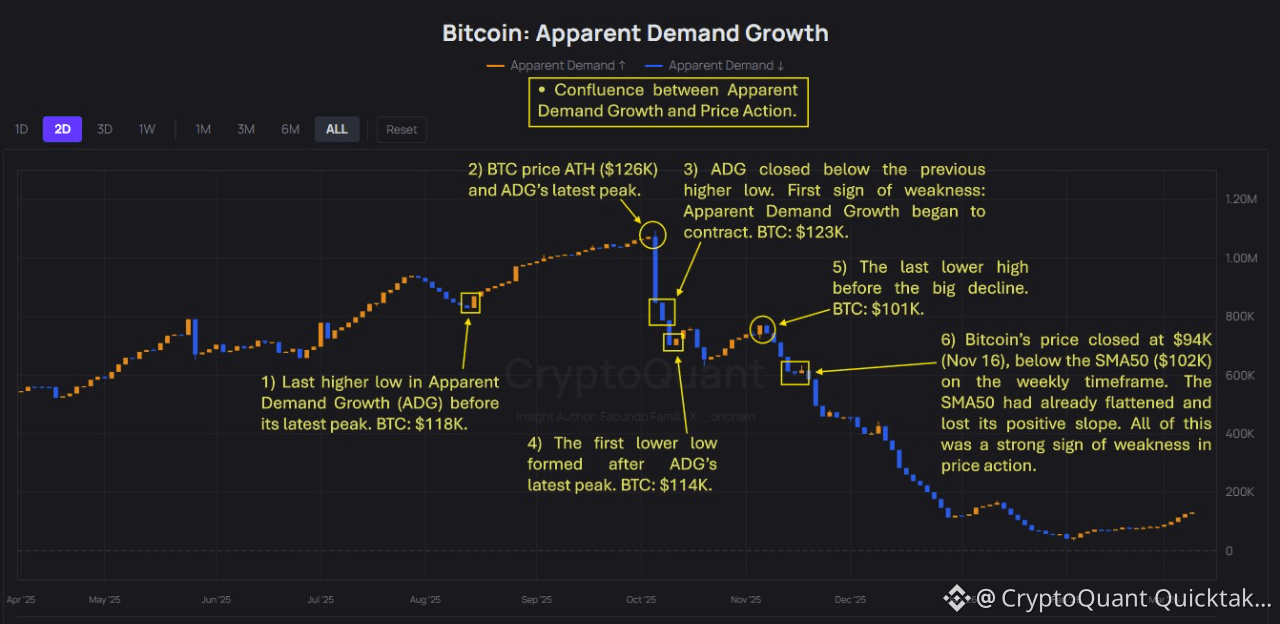
• I show the indicator from a macro perspective to provide historical context, and from a micro perspective to identify when the most recent structural break occurred.
• Renko is a Japanese charting method from the 19th century, introduced to the Western world by Steve Nison in his book Beyond Candlesticks (1994). His work was later continued by Prashant Shah, CMT and CFTe. The key distinction is dimensional: candlesticks are two-dimensional, as they use both time and value. Renko is one-dimensional. It only plots a new brick when value moves by a defined amount, removing time from the equation entirely. This makes it a "noiseless" chart.
Written by Facundo Fama