$BTC Bitcoin (BTC) is currently trading around $67,380, showing a strong bearish move on the 1-minute chart. Recent candles indicate that sellers have taken control of the market, pushing the price down from the local high near $67,661 to the recent low around $67,365.
📉 What the Chart Shows
Consecutive red candles signal strong selling pressure.
Volume increased during the decline, confirming active sellers.
Short-term momentum remains bearish.
$BTC BTC is currently testing an important support zone near $67,350–$67,300.
🔍 Possible Next Move If Bitcoin holds above the $67,300 support, a short-term bounce toward $67,500–$67,600 could happen.
However, if sellers break below $67,300, $BTC BTC may continue its correction and test lower support levels around $67,100–$67,000.
⚠️ Trader Insight The market is currently in a pullback phase after recent upward movement. Traders should watch volume and support levels closely before expecting a strong recovery.
📊 Key Levels ✅ Support: $67,300 | $67,100
✅ Resistance: $67,500 | $67,660
Conclusion Bitcoin remains under short-term pressure, but as long as the $67,300 zone holds, buyers may attempt a recovery. A clear break below support could lead to further downside before the next bullish move.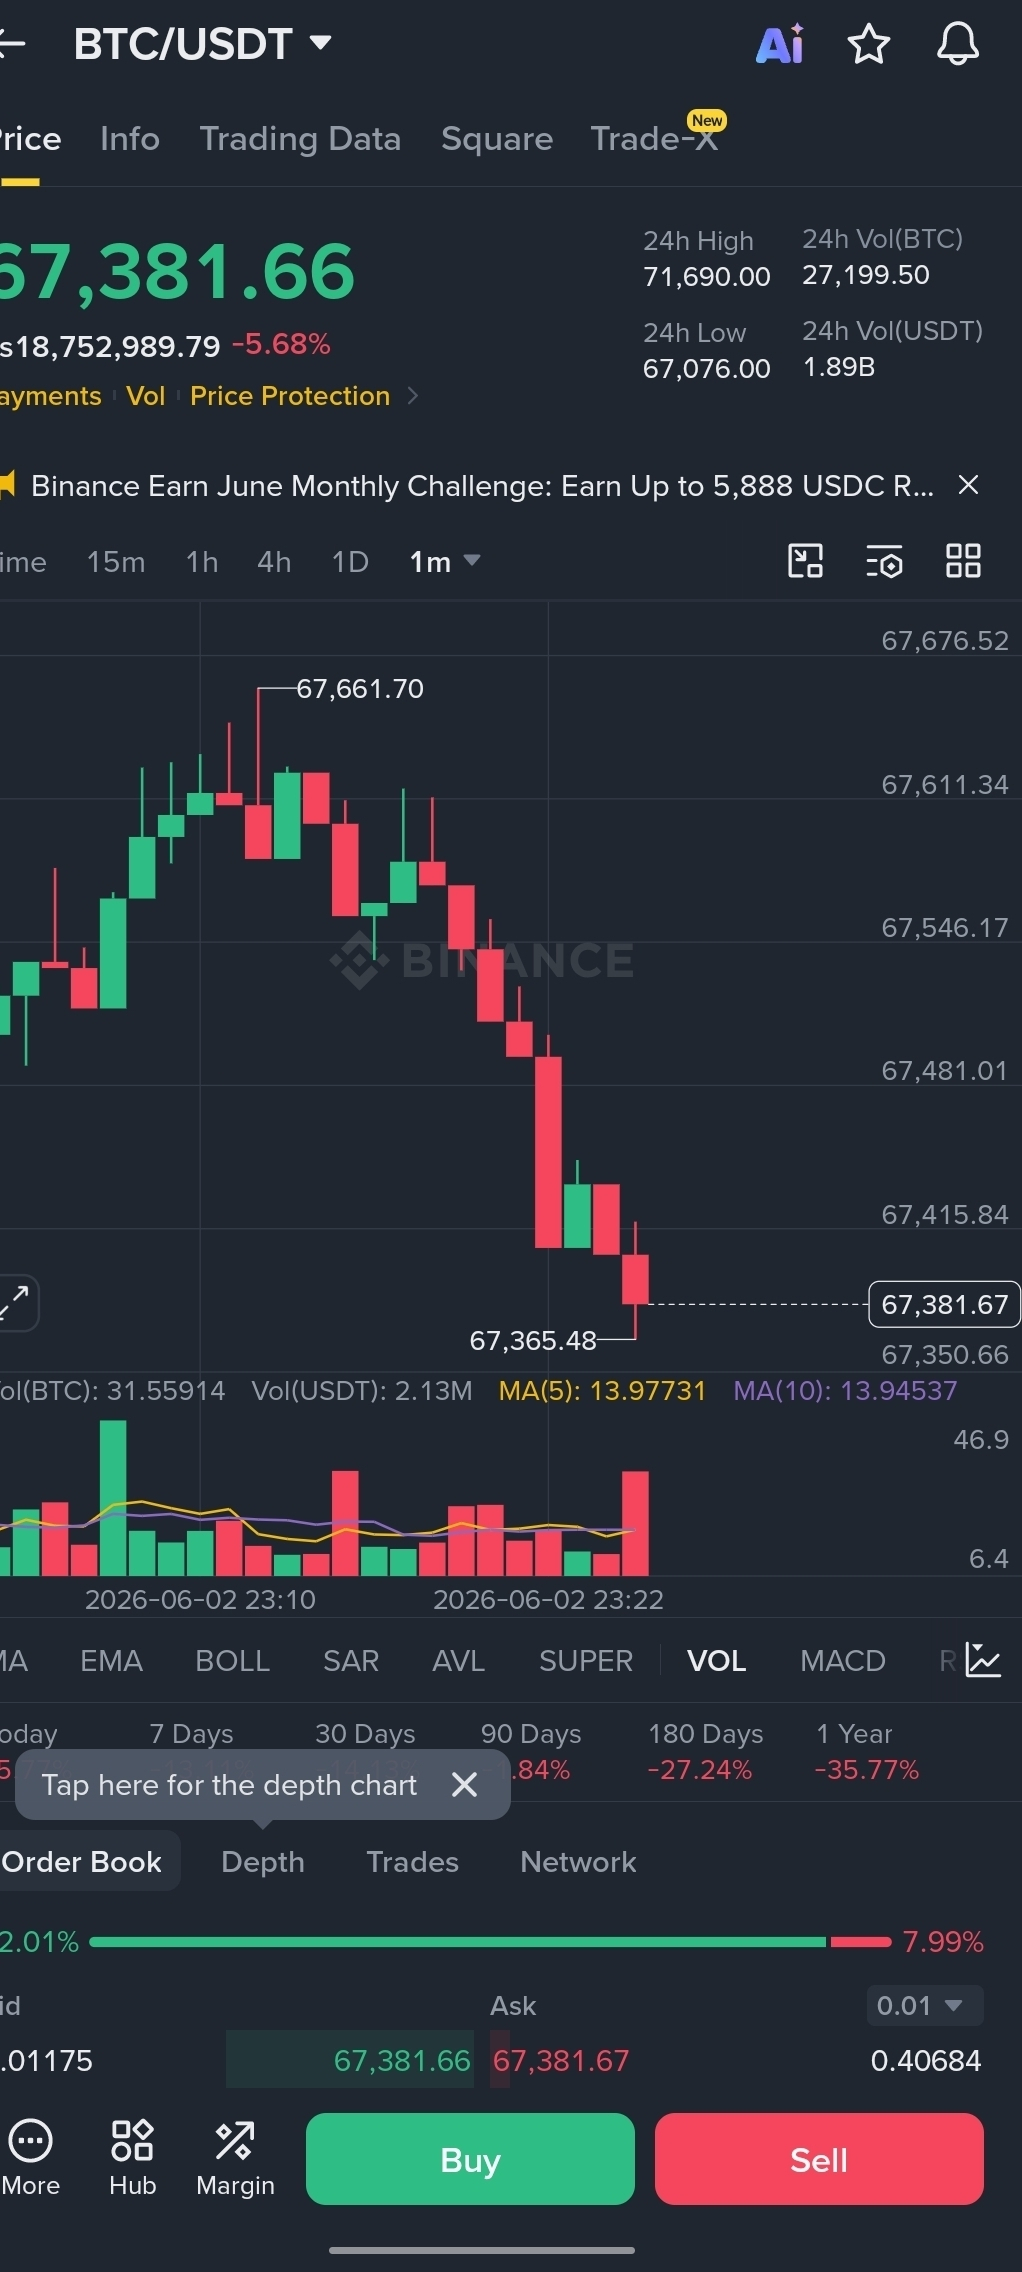
#Bitcoin #BTC #Crypto #BinanceSquare #Trading #MarketUpdate #CryptoNews