
🚀 🚀
Take a close look at the 4H chart for $NEAR . Price action is getting tightly compressed into a corner, meaning a major volatility explosion is right around the corner.
Here is what the chart is telling us right now:
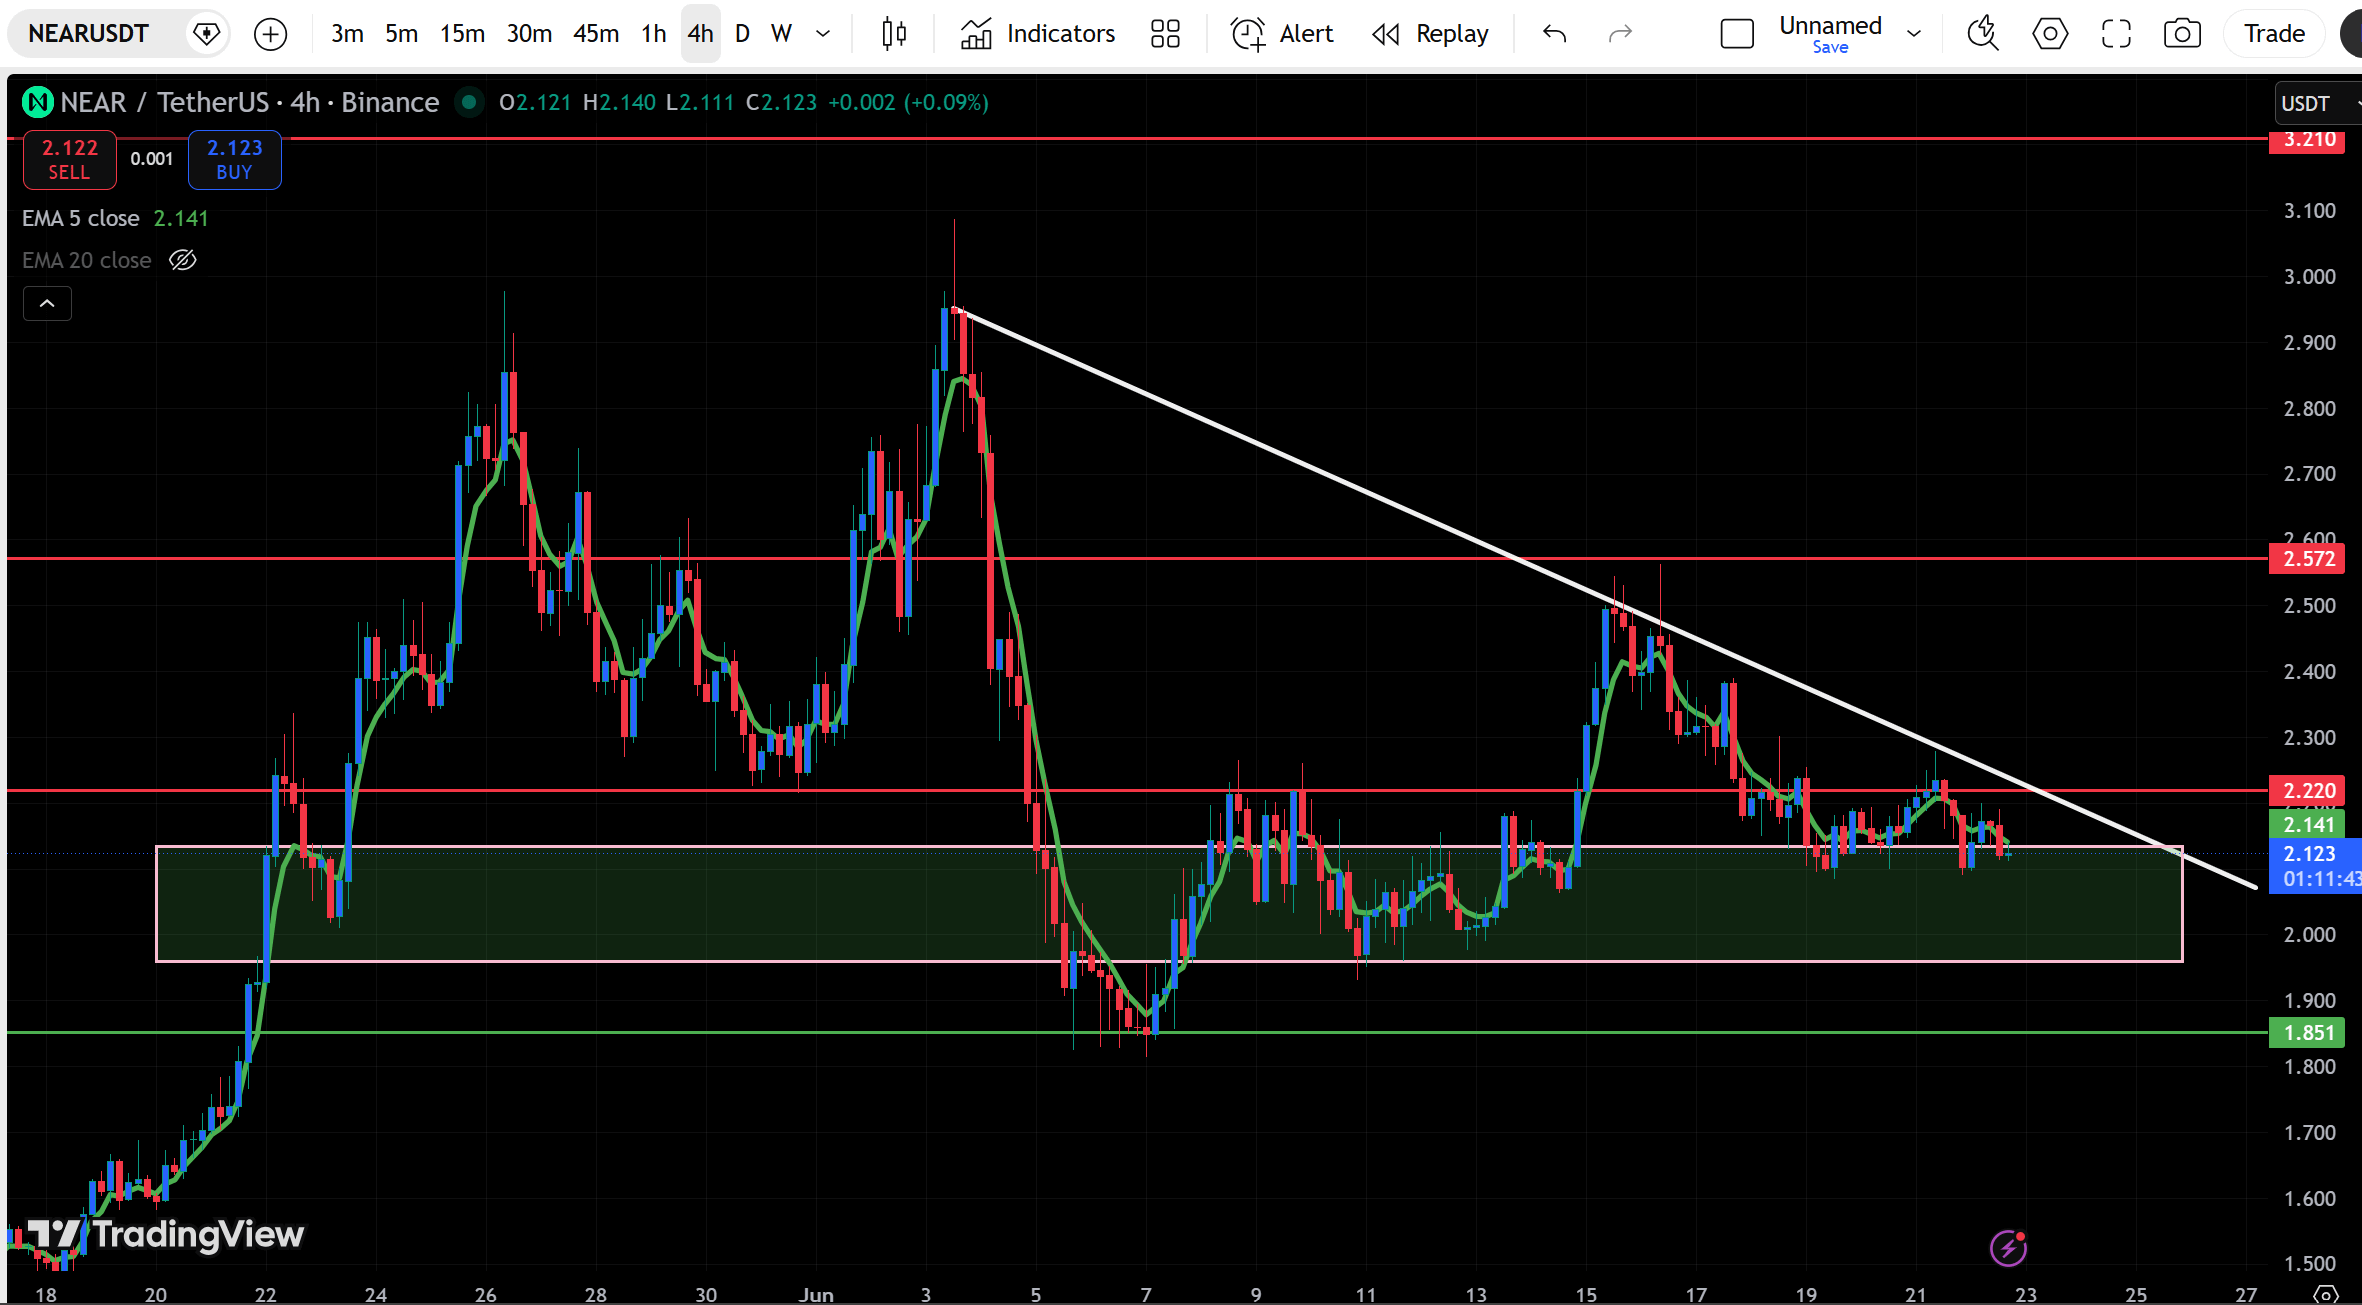
The Trendline Resistance: A heavy white descending trendline has been capping every single relief rally, forcing the price into lower highs.
The Demand Zone: Bulls are fiercely defending the massive horizontal accumulation block (the pink box) sitting right between 1.950 – 2.120.
The Compression: Currently trading at 2.123, $NEAR is running out of room to move. It is grinding right at the apex of this massive pattern.
🎯 The Game Plan
The Bull Scenario: A clean 4H candle close above the white trendline and the 2.220 red resistance line triggers the breakout. If this flips to support, expect a rapid move toward 2.572.
The Bear Scenario: If buyers fail to hold this pink demand zone, a breakdown could send the price down to test the next major baseline at 1.851.
The coil is tight, and the next move will likely be explosive. 💸
Are you front-running the breakout here, or are you waiting for confirmation? Let me know your targets in the comments! 👇
#Near #nearprotocol #cryptotrading #TechnicalAnalysis #NEAR🚀🚀🚀