$BITCOIN Bärenmarkt Realitätstest 📉
Jeder Bitcoin-Bärenmarkt fühlt sich im Moment katastrophal an – aber die Zahlen erzählen eine konsistente Geschichte.
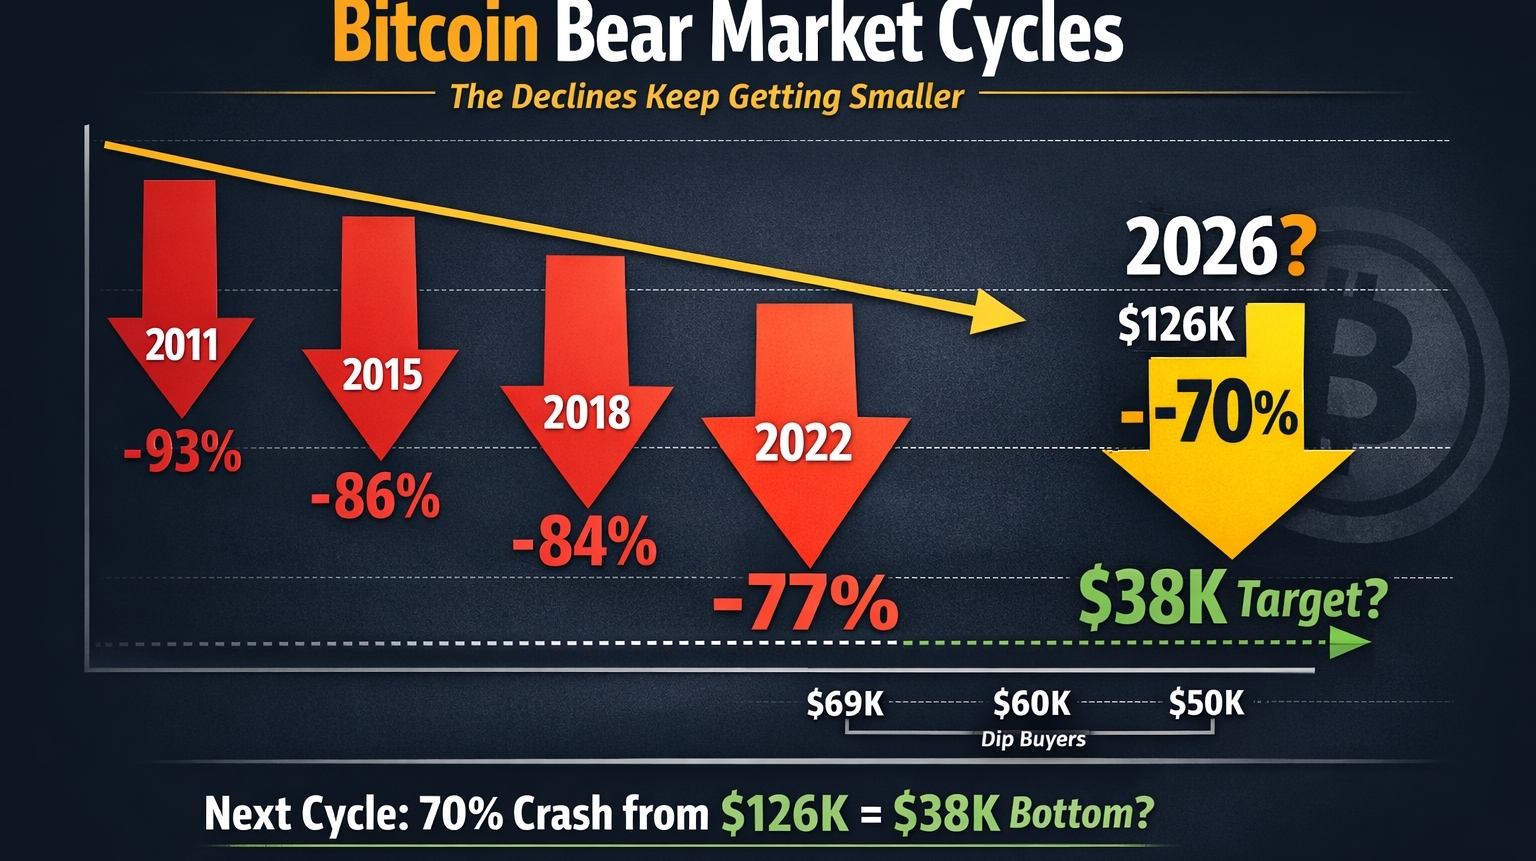
Historische $BTC Rückgänge:
2011: −93%
2015: −86%
2018: −84%
2022: −77%
Hier gibt es einen klaren Trend: Der Crash jedes Zyklus ist ungefähr 7% weniger schwerwiegend als der vorherige.
Wenn dieses Muster anhält, deutet der nächste Zyklus auf einen Rückgang von etwa −70% hin.
Jetzt rechne nach:
Zyklus-Hoch: $126K
−70% Korrektur = ~$38K potenzieller Boden
Deshalb endet das Verfolgen von „Dip-Käufen“ bei $69K, $60K oder $50K oft in Enttäuschung. Was sich emotional billig anfühlt, ist nicht immer strukturell billig.
Märkte belohnen keine Ungeduld.
Sie belohnen diejenigen, die bereit sind zu warten, wenn die Überzeugung verschwindet.
Ich jage nicht nach dem Lärm.
Ich werde näher auf $38K achten — denn die Geschichte lügt selten $BTC
