$BTC The cryptocurrency market is currently experiencing a dynamic "Volatility Phase." Following a significant downturn over the past 48 hours, the market is now showing promising signs of recovery. This article provides a detailed analysis of recent events, breaking news, and key technical indicators.
1. Market Overview: The Great Dip and Resilient Recovery
The past few days saw major cryptocurrencies, led by Bitcoin, undergo a sharp sell-off. However, today marks a strong attempt by prices to stabilize and rebound.
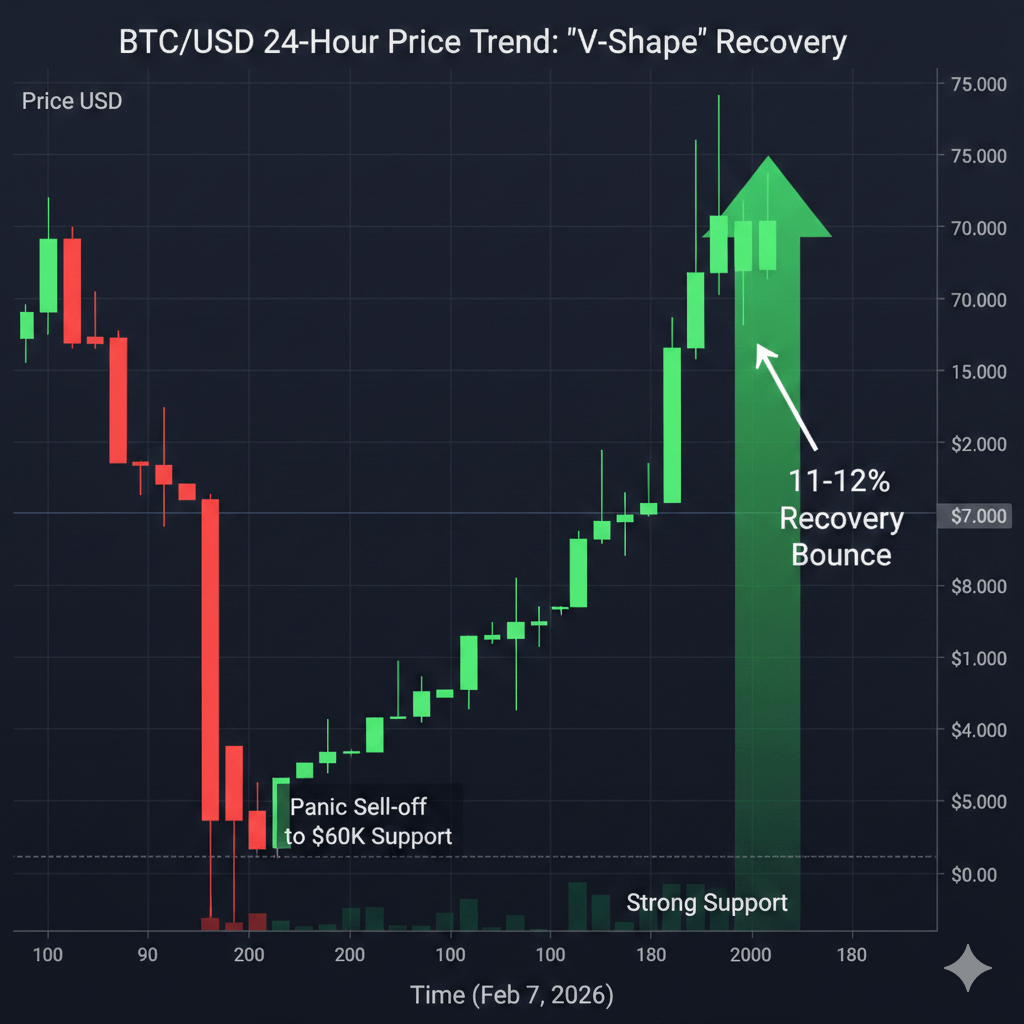
Bitcoin (BTC): After touching a critical psychological support level near $60,000, BTC has demonstrated a robust recovery, currently trading above $70,600. This represents a significant gain of approximately 11% to 12% in the last 24 hours.
Ethereum (ETH): Following Bitcoin's lead, Ethereum has also bounced back from the $2,000 mark and is now trading within the $2,060 - $2,100 range.
Global Market Capitalization: The total cryptocurrency market cap stands at approximately $2.48 Trillion, reflecting a healthy 9% improvement from yesterday's lows.
Here's a conceptual graph illustrating Bitcoin's recent price action:
2. Breaking News: Key Developments Driving the Market
Trump Administration & Regulation: The return of the Trump administration initially fueled crypto-friendly sentiments. However, the recent market dip caused some investor apprehension. On a more positive note, new legislation concerning stablecoins has been signed into law, which is expected to bring long-term stability and clarity to a crucial segment of the crypto market.
Institutional "Buy-the-Dip": While publicly traded companies like MicroStrategy saw their shares decline during the market crash, reports indicate significant "Whale" accumulation in the $60,000-$62,000 range. This suggests that large institutional investors viewed the dip as a buying opportunity.
XRP's Impressive Surge: XRP has been a standout performer in today's market, witnessing an impressive surge of approximately 20% to 25%, pushing its price above $1.45. This strong performance might be linked to ongoing developments or renewed investor confidence.
3. Technical Analysis: Key Indicators and Future Outlook
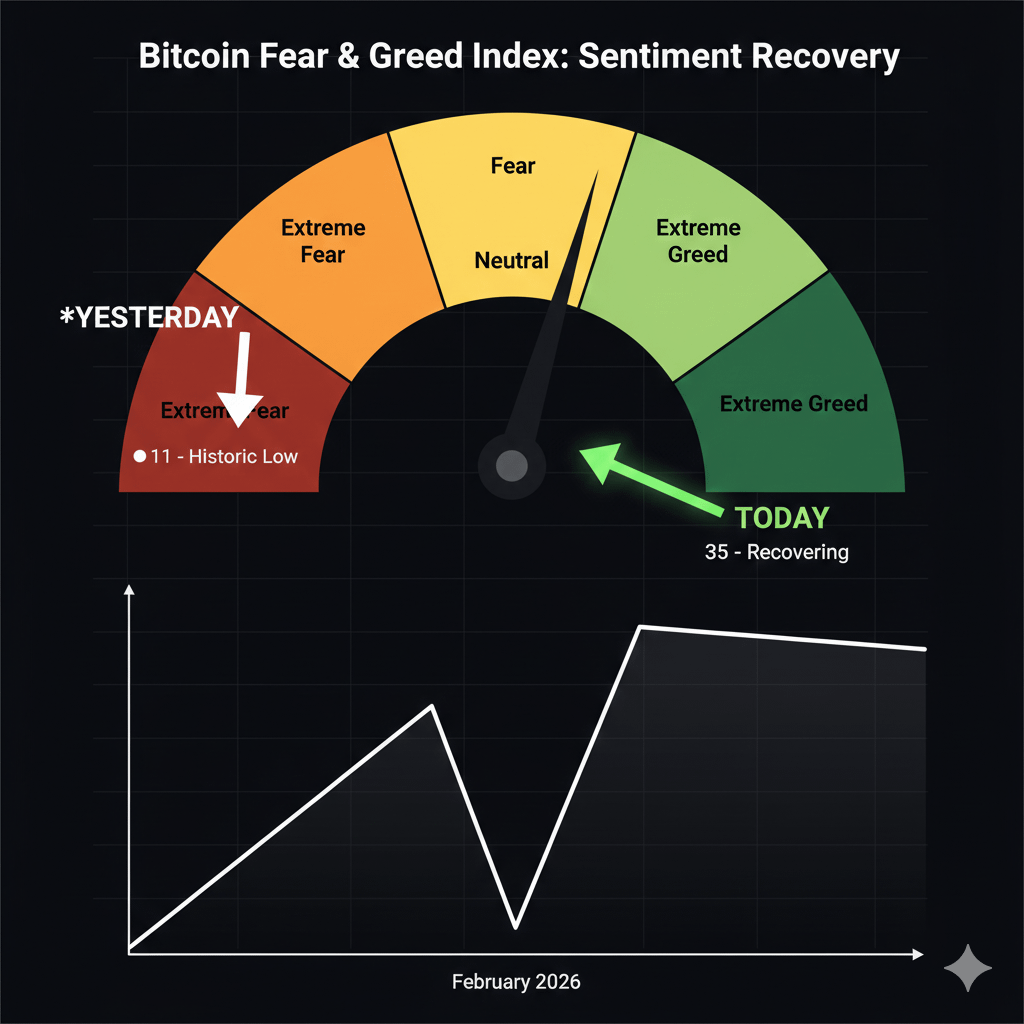
The market's Fear & Greed Index had plunged to "Extreme Fear" (11 points) yesterday, reaching a historic low. Today, we're observing a noticeable improvement as sentiment begins to recover.
Let's examine some key technical indicators:
Indicator Status Key Levels to Watch
RSI (Relative Strength Index) Oversold (Rebounding) Bitcoin's RSI dropped significantly during the dip and is now in a clear recovery phase, indicating buying pressure.
Support Levels Strong at $58,000 Should the market face another downturn, the $58,000 level is expected to provide robust support.
Resistance Levels $72,000 - $75,000
Here's an illustrative representation of the Fear & Greed Index's recent movement: