Everyone seems obsessed with using linear scale on weekly $BTC charts. Sure, it looks cool, but it’s not the best for spotting macro bottoms or long-term trend support.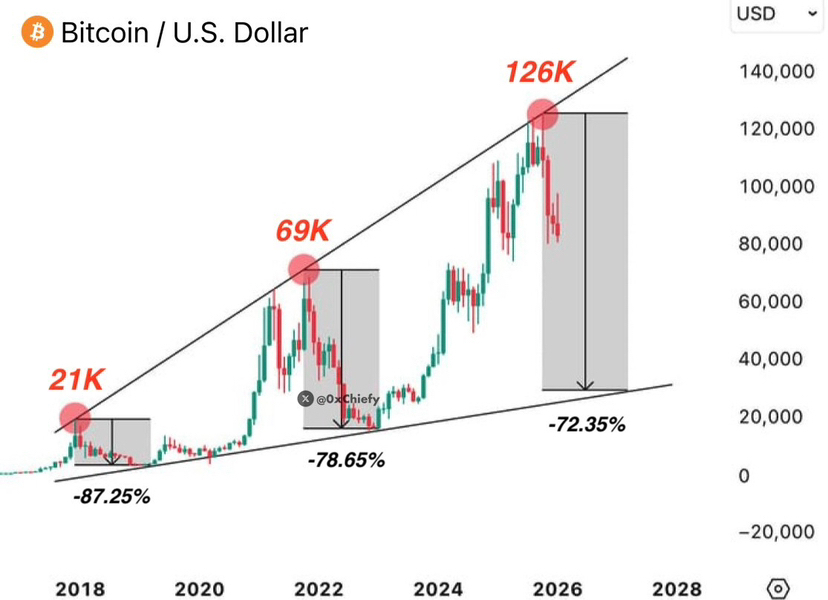
Here’s the deal: linear charts treat price like straight-up dollar moves. That’s fine for small swings, but for an asset that grows exponentially across cycles? Early cycles get squished, recent moves look huge, and suddenly projected bottoms look way lower than they really are.
For real macro trend lines and weekly cycle work, log scale is the smarter play. It respects percentage growth, keeps cycles proportional, and actually shows the structure as it is. Linear is fine for short-term stuff. Log is the tool for multi-year trends and bottom analysis.
It’s one of those subtle things that can make your charting look slick but totally mislead if you don’t pay attention.


#Squar2earn #bitcoin #BitcoinDunyamiz #ETFvsBTC #ETHETFsApproved