The chart is screaming something important.
And most people are ignoring it.
On the higher timeframe, $SOL just lost a major horizontal support zone — a level that held multiple times before.
When strong support breaks… it usually means one of two things:
1️⃣ Real distribution → deeper correction
2️⃣ Fake breakdown → massive short squeeze
Right now, price is sitting under previous structure.
That’s not bullish.
But here’s the twist…
⸻
📉 What the Chart Is Actually Showing
• Lower highs forming
• Strong rejection from mid-range resistance
• Breakdown below key support
• Momentum accelerating on the downside
This is classic trend weakness.
If bears stay in control, the next liquidity pocket sits much lower.
Could $SOL see $30?
Technically — yes, in a full market panic scenario.
But ask yourself:
Would institutions let it fall that easily?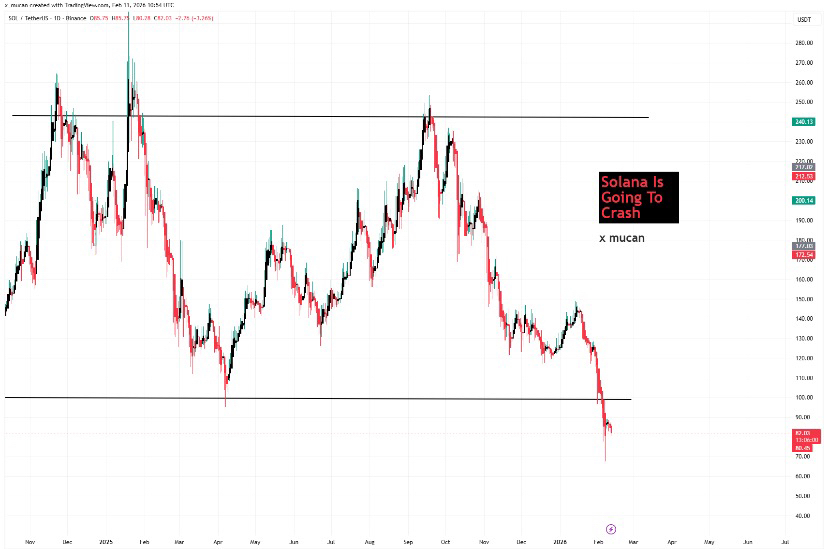
⸻
🧠 The Smart Money Question
When everyone starts shouting “CRASH”…
That’s usually when volatility spikes.
If SOL reclaims the broken support and closes back above it — this entire breakdown becomes a bear trap.
And bear traps create violent upside moves.
⸻
🔥 So What Happens Next?
Two clear scenarios:
🔴 Scenario 1:
Failure to reclaim → continuation lower → deeper retracement zone unlocks.
🟢 Scenario 2:
Strong reclaim + volume → squeeze toward previous resistance.
No emotion. Just structure.
⸻
⚠️ The Real Risk
The biggest danger right now isn’t price.
It’s overconfidence.
Whether you’re bullish or bearish on SOL — this is a decision zone.
And decision zones create big moves.
⸻
If you’re holding $SOL…
Watch the reclaim.
If you’re sidelined…
Wait for confirmation.
Because the next 2–3 weekly candles could define the entire quarter.
⸻
💬 Comment your target for $SOL — $30 or recovery first?
Follow for more clean chart breakdowns.