Die Geschichte wiederholt sich nicht perfekt — aber sie reimt sich. Und im Moment sieht Bitcoin sehr ähnlich aus wie die Struktur der Zyklen von 2017 und 2021.
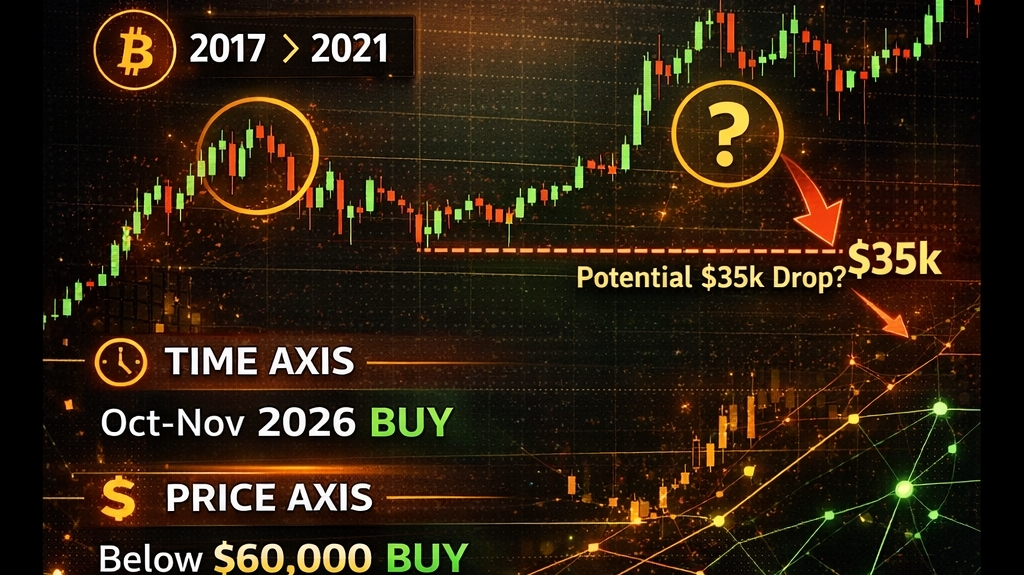
Es besteht eine reale Möglichkeit, dass wir einen starken Rückgang sehen — sogar in Richtung der $35.000-Region in einer schnellen Korrektur. Die Frage ist: Bist du vorbereitet, wenn das passiert?
Meine Strategie basiert auf zwei Dingen:
ZEIT + PREIS
Die meisten Händler konzentrieren sich nur auf den Preis. Deshalb verpassen sie ständig die besten Einstiege.
1️⃣ Die ZEIT-Achse
Ich verfolge die Anzahl der Tage von jedem Halving-Zyklus bis zum endgültigen Tiefpunkt des Bärenmarktes:
2012 Zyklus: 406 Tage
2016 Zyklus: 363 Tage
2020 Zyklus: 376 Tage
2024 Zyklus: Entwickelt sich noch
Fällt dir etwas auf? Das Timing ist über die Zyklen hinweg sehr ähnlich.
Wenn dieses Muster anhält, fällt das wahrscheinlichste Fenster für das nächste große Tief zwischen Oktober und November 2026.
Das ist mein zeitliches Ziel.
Wenn dieses Fenster kommt, kaufe ich — unabhängig davon, wie der Preis aussieht. Denn zeitbasierte Einstiege verhindern, dass du von dem Markt überholt wirst.
2️⃣ Die PREIS-Achse
Während ich auf das Zeitfenster warte, ignoriere ich den Preis nicht.
Ich begann zu akkumulieren, als wir die $60.000-Zone betraten.
Warum?
Denn das Warten auf das „perfekte“ Niveau ist der Grund, warum Menschen die gesamte Bewegung verpassen.
Einzelhändler sagen: „Ich kaufe nur zu X Preis.“
Aber wenn der Preis dieses Niveau nie berührt, bleiben sie zurück.
Mein Rahmen ist einfach:
Wenn der Preis Wert bietet → beginne ich zu kaufen.
Wenn die Zeit das historische Fenster erreicht → kaufe ich unabhängig.
Diese einzelne Struktur hält mich konstant.
Im Oktober, als Bitcoin bei etwa $114.000 gehandelt wurde, sagte ich, ich würde ein starker Käufer in der Nähe von $60.000 sein. Viele Leute lachten. Sie sagten, wir würden dieses Niveau nie wieder sehen.
Ich streite nicht mit Lärm. Ich folge der Struktur.
Jetzt haben wir diese Zone erreicht. Aber das Risiko eines tieferen Tiefs besteht immer noch — weshalb die ZEIT-Achse wichtig ist.
Mein Plan
ZEIT-Strategie:
Oktober–November 2026 = Starker KAUF, unabhängig vom Preis.
PREIS-Strategie:
Unter $60.000 = Starker KAUF, unabhängig von der Zeit.
Wenn eine der Bedingungen erfüllt ist, führe ich konsequente tägliche Käufe aus.
Der letzte Indikator, den ich beobachte: NUPL
Netto unrealized Profit/Verlust (NUPL) ist eine On-Chain-Metrik, die historisch gesehen große Zyklustiefs signalisiert.
Es blinkte während:
2018 Bärenmarkt Tief
Der COVID-Crash
2022 Zyklus Tief
Im Moment sind wir noch nicht in dieser extremen „blauen Zone“.
Deshalb wäre ich nicht überrascht, Bitcoin Ende 2026 im Bereich von $45K–$50K zu sehen. Das ist die Zone, in der ich mich wohl fühlen würde, aggressiv zu sein.
Der Markt fühlt sich gerade chaotisch an — aber jeder Zyklus durchläuft diese Phase.
Studie Struktur. Studie Zeit. Studie Psychologie.
Und denk daran: Die größten Chancen kommen selten, wenn die Schlagzeilen sicher erscheinen.
Bereit bleiben.


#BTC
#Bitcoin
#CryptoMarket #BitcoinCycle #CryptoAnalysis #onchaindata #NUPL