
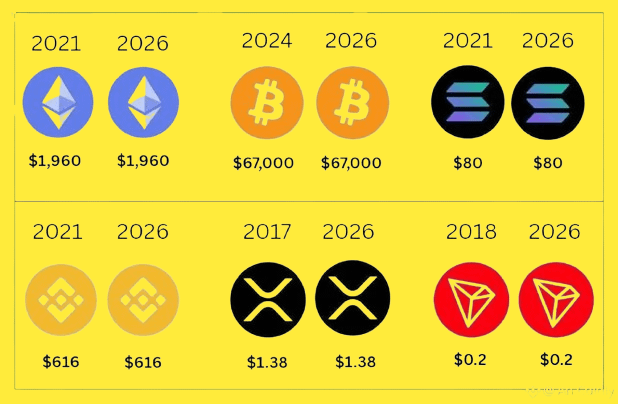
When I look at this picture, what I don’t see is coincidence. I see market structure repeating itself.As a technical analyst, one of the first lessons you learn is that price has memory. Markets rarely invent completely new behavior; they revisit levels where strong decisions were made before. The numbers in this image — $BTC around 67K, $ETH near 2K, $BNB in the 600s, XRP around 1.3, TRX near 0.2, SOL around 80 — these aren’t random targets. They are psychological zones. Liquidity lives there. So does emotion.
In every cycle, retail investors tend to believe the next rally must go far beyond the previous high immediately. But in reality, the market often does something more subtle: it returns to old resistance, tests it, shakes out weak hands, and only then decides whether a true expansion phase begins.
From a technical perspective, these repeated price zones act like magnets. Order books get thick. Sellers who were trapped before finally break even and exit. Smart money watches how price behaves there — not just whether it reaches the level, but how it reacts once it gets there.
Another thing people underestimate is time. Cycles stretch longer than most traders expect. What feels like “nothing happening” is often accumulation in disguise. Volatility contracts, narratives fade, and that’s usually when positioning quietly shifts.
If the market does revisit these historical zones again by 2026, the real question won’t be whether those prices are reached. The real question will be:
Does volume expand? Does momentum follow through? Or does rejection come fast and violent?
Because reaching a level is easy.
Holding above it is what separates a rally from a true bull market.
That’s what I see when I look at this image — not a prediction, but a reminder:
Markets don’t just move forward. They echo.