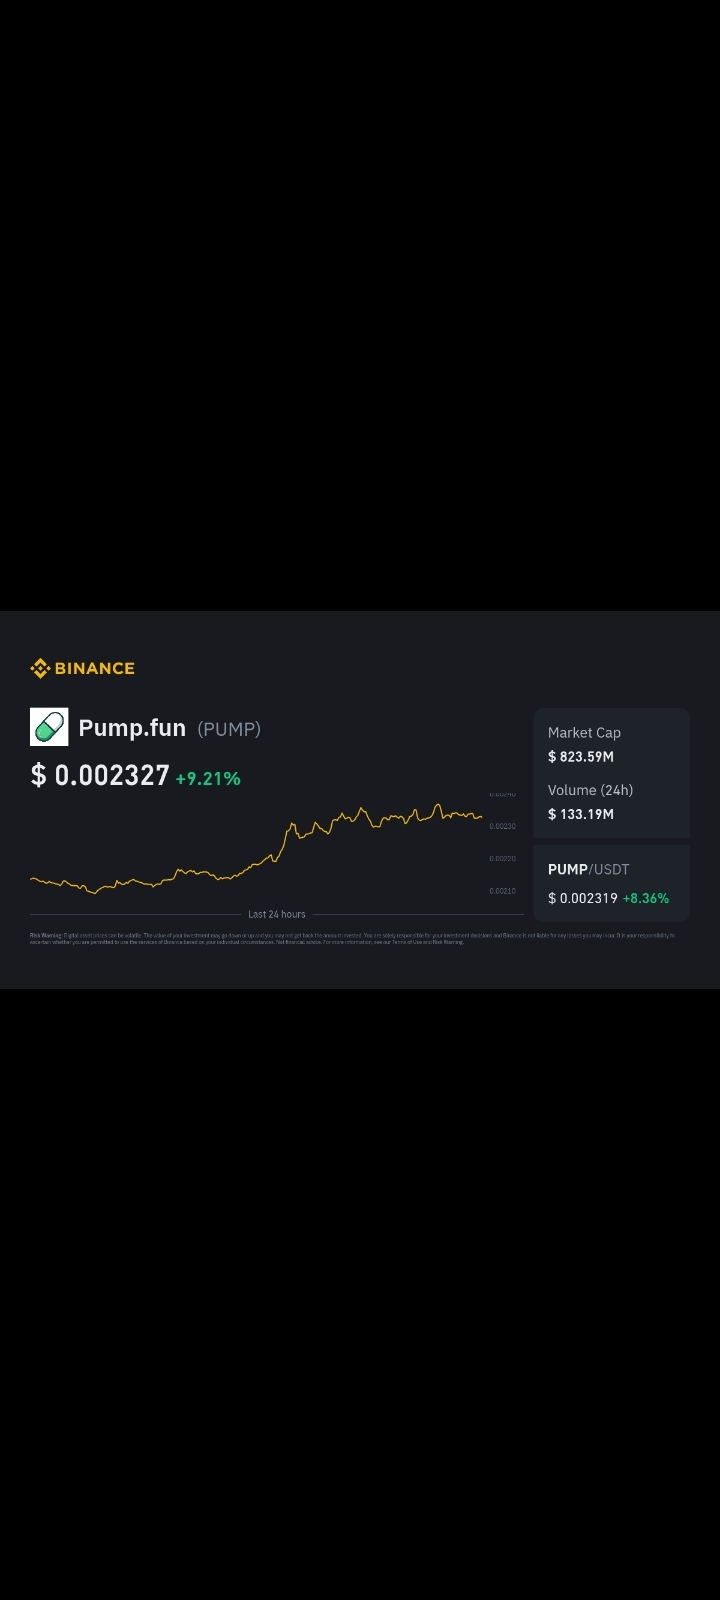
📊 The first chart from Binance displays #pump live 24-hour price trend (spot market) — good for posting with a daily update.
📈 The next chart (from TradingView analysis) highlights how PUMP broke out of a down channel and indicates bullish momentum potential.
📊 The third chart shows recent #dex revenue or activity surge, signaling increased trading interest.
📉 The fourth visual from another source gives context on past price ranges and resistance levels.