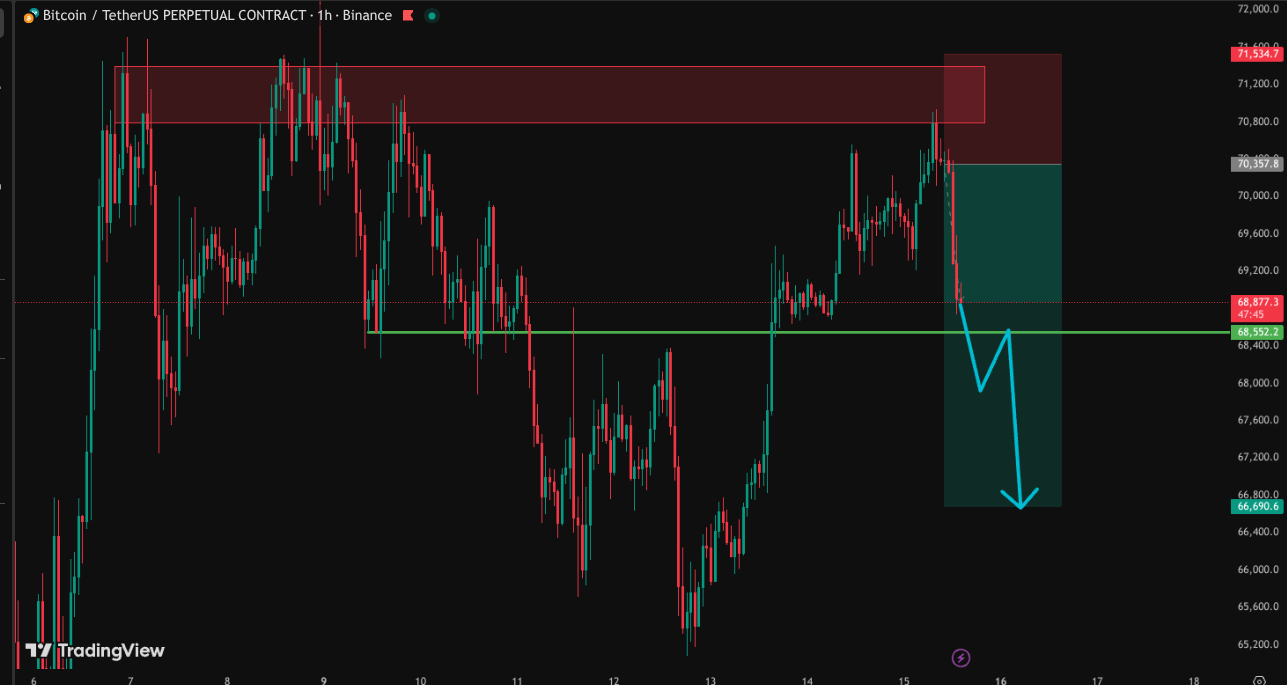
Recently, Bitcoin reached the $70,000 region and tapped a key supply zone on the 1-hour timeframe. This area previously acted as resistance, meaning sellers were likely waiting there to take profits or open short positions.
As expected in technical analysis, when price enters a strong supply zone, selling pressure increases — and that’s exactly what happened.
🔎 What Caused the Drop?
Here’s a simple breakdown for beginners:
1️⃣ Supply Zone Reaction
The $70K level aligned with a 1H supply area. Supply zones are regions where large sellers previously stepped in. When price revisits these zones, it often faces rejection.
2️⃣ Profit Taking Near Psychological Level
$70,000 is a major psychological level. Round numbers often attract heavy profit-taking, especially after strong upward momentum.
3️⃣ Short-Term Target Achieved
After rejection from supply, Target 1 was achieved as expected, confirming the short-term downside reaction.
🎯 What’s Next?
The next downside level to watch is $66,000.
If bearish momentum continues and lower timeframes maintain a bearish structure, price may move toward that level. However:
If buyers step in strongly before $66K
Or if market structure shifts bullish again
Then the pullback could be temporary.
🧠 What Beginners Should Learn From This
Price reacts strongly at supply and demand zones.
Psychological levels (like $70K) increase volatility.
Always wait for confirmation instead of predicting blindly.
Targets should be planned before entering trades.
Markets move in cycles: impulse → correction → continuation or reversal.
Right now, this looks like a technical correction from a supply zone — not necessarily a full trend reversal.