📉 Market Structure Overview (Weekly)
1️⃣ Major Trend Context
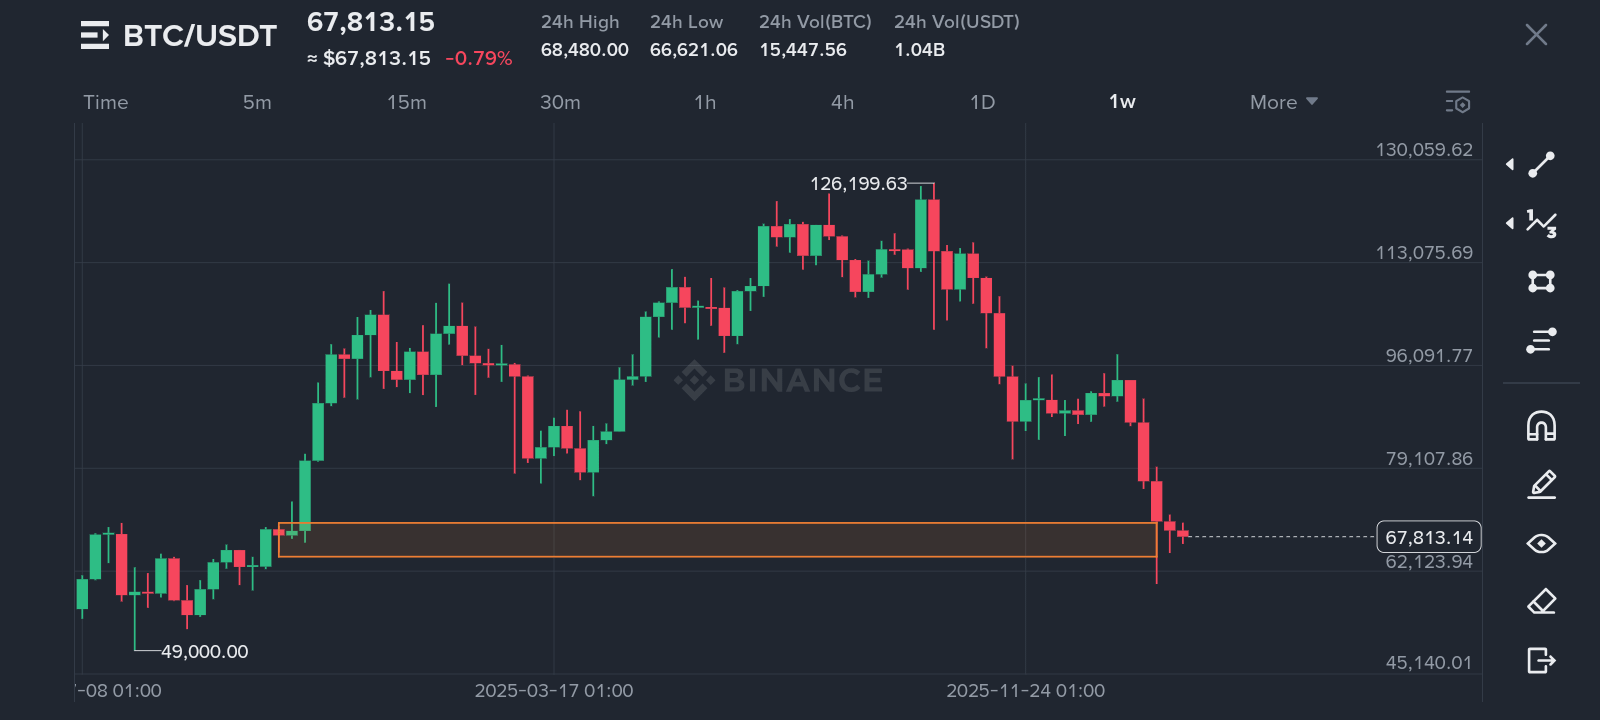
$BTC rallied from around $49,000 to a peak near $126,199.
That move formed a strong macro uptrend.
Since topping, price has been printing lower highs and lower lows → clear weekly downtrend structure.
This is not just a pullback — structurally it’s a corrective phase after a major expansion.
🟫 Key Zone Highlighted (Orange Box)
The orange area you marked appears to be a previous resistance turned support zone, roughly around:
$62,000 – $70,000 region
This zone likely:
Acted as consolidation before the big breakout.
Is now being retested as demand.
Right now, BTC is sitting directly on this level.
🔎 What This Means
Scenario 1: Bullish Reaction
If BTC:
Holds above ~$62K weekly close
Prints a strong bullish engulfing or long lower wick
Volume increases
Then this could become a high-timeframe demand bounce, possibly targeting:
$79K
$96K
Then $110K region
That would signal a macro higher low formation.
Scenario 2: Breakdown Risk
If BTC:
Closes weekly below ~$62K
Fails to reclaim quickly
Then next probable downside liquidity zones:
$55K
Psychological $50K
Possibly even full retrace toward $49K base
That would confirm deeper macro correction.
📊 Momentum Insight
The recent drop from ~$96K to ~$67K was:
Aggressive
High momentum
Mostly red weekly candles
That suggests sellers are currently dominant — but price is now at a decision level.
🧠 My Strategic View
This is a make-or-break zone.
Bulls need a strong reaction here.
Bears want a confirmed weekly close below the orange zone.
The next 1–2 weekly closes will define Q1–Q2 structure.