$AWE has dropped nearly -40% in a single day, but this wasn’t random. The chart clearly shows a classic blow-off top followed by aggressive distribution and a liquidation cascade. Let’s break it down step by step.
📍 Phase 1: Parabolic Expansion 🚀
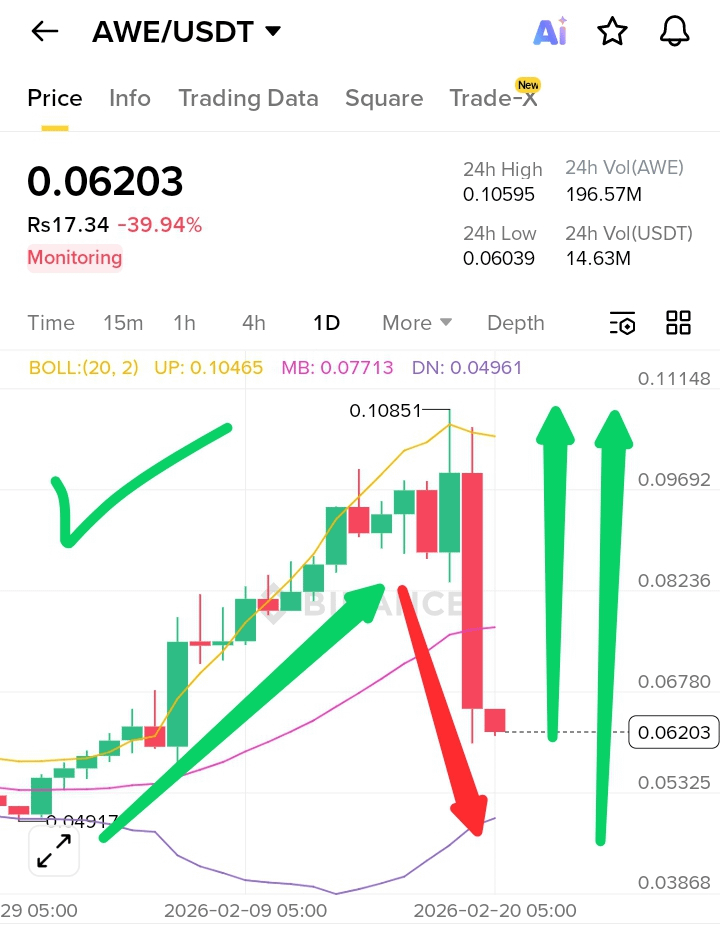
Price rallied strongly from the 0.049 zone toward 0.108, forming consecutive bullish candles above the mid Bollinger Band. This type of vertical move usually indicates momentum chasing and late buyers entering near the top. Volatility expanded sharply, and price stretched far from its equilibrium (MB around 0.077).
📍 Phase 2: Rejection at 0.108 Supply Zone ❌
At 0.1085, price hit a clear resistance area and immediately showed rejection wicks. This level acted as a prior supply zone where early buyers likely started taking profit. When a market moves too far too fast, profit booking becomes aggressive.
📍 Phase 3: Breakdown & Liquidation 📉
Once price lost the mid Bollinger Band support, momentum flipped. A large bearish candle followed, breaking structure and triggering stop-losses from late long positions. This created a cascade effect — stop hunts + panic selling + leveraged long liquidations. That’s why the drop looks vertical.
📍 Why So Aggressive?
• Overextended rally before correction
• Profit-taking at resistance
• Loss of key support (0.082–0.085 zone)
• Liquidation of overleveraged longs
• Short-term sentiment shift
📊 Current Position
Uptrend → Overextension → Rejection → Breakdown
Currently in: Volatility Reset Phase
📍 What Next?
Price is now near the lower Bollinger region (~0.05–0.06). This zone can act as temporary stabilization support. However, unless $AWE reclaims 0.075–0.080 with strength, upside momentum remains weak. Expect consolidation before any sustainable recovery attempt.
Strong reminder: vertical pumps often lead to vertical corrections. Structure > Emotion.
If this breakdown helped you understand the real reason behind the dump, LIKE 👍 and FOLLOW 🔔 for more roadmap-style crypto
#AWE #cryptoanalysis #binancesquare #priceaction #liquidation