📊 BTC/USDT – Current Price Action Chart (Conceptual Image)
(Note: This chart is a dynamic view model similar to what you’d see on TradingView, incorporating a wedge pattern + resistance + RSI)
Chart Notes:
• BTC price trading below ~$69k resistance area
• Upper boundary (resistance) ~69,000–69,500
• Wedge / consolidation range between upper resistance and lower trendline
• Potential short setup if price rejects near upper boundary
📉 Technical Interpretation (Your View Converted)
Bullish bearish context:
Price continues to trade within a wedge-like consolidation — akin to a tightening range as buyers/lows compress toward sellers.
RSI type oscillators in many wedge setups signal declining momentum into the upper trendline — classic bearish wedge characteristic.
Your potential trade plan (translated):
🔻 Open Short BTC around $69,000 if resistance holds and price shows rejection/candle sell signal
📉 Target areas:
— $67,000 (1st downside target)
— $65,000 (2nd target zone)
⛔ Place stop above the resistance zone (e.g., ~$69.5k–$70k) if volume spikes and breaks higher
Why this pattern is relevant:
A rising wedge / converging wedge is generally seen as bearish reversal/continuation if price fails the upper boundary and breaks down.
Decreasing buying volume + RSI nearing overbought often precedes head-fake tests then move toward the lower boundary.
🧠 Tips Before Opening a Position
Wait for confirmation — e.g., a bearish candlestick pattern or break below short-term support trendline near ~$68.5k before aggressively shorting.
Volume confirmation — ideal to see higher selling volume on rejection to reinforce a bearish continuation.
Timeframe alignment — best confirmation often comes from 4H or Daily chart 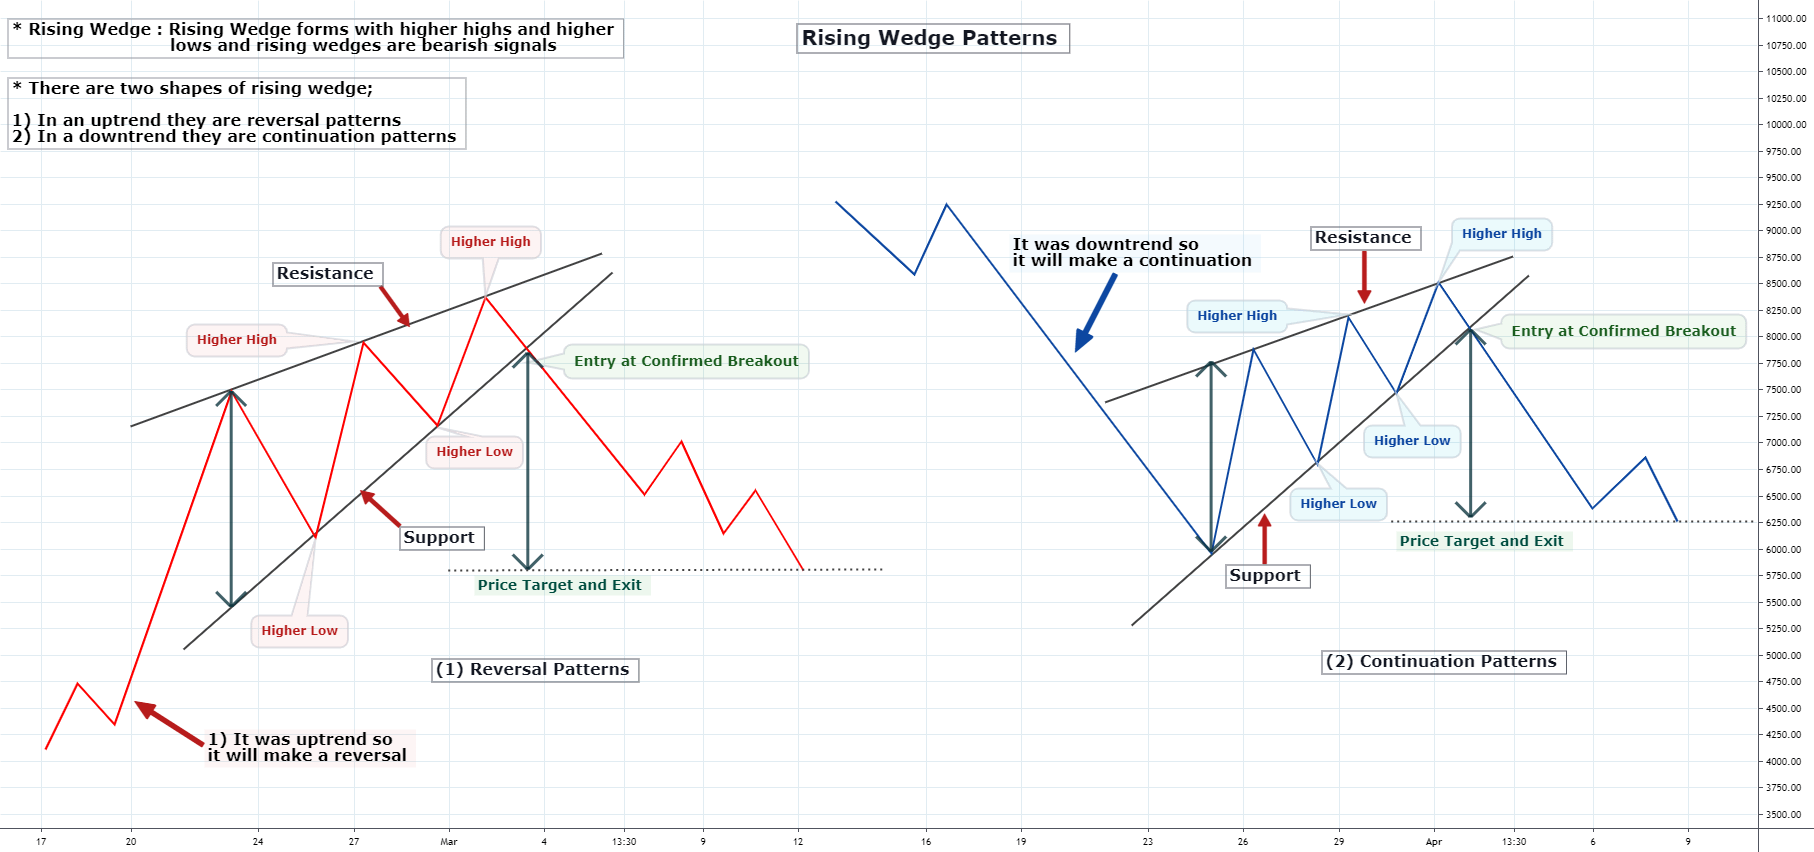 signals together with the wedge pattern.