1️⃣ Current Market Structure
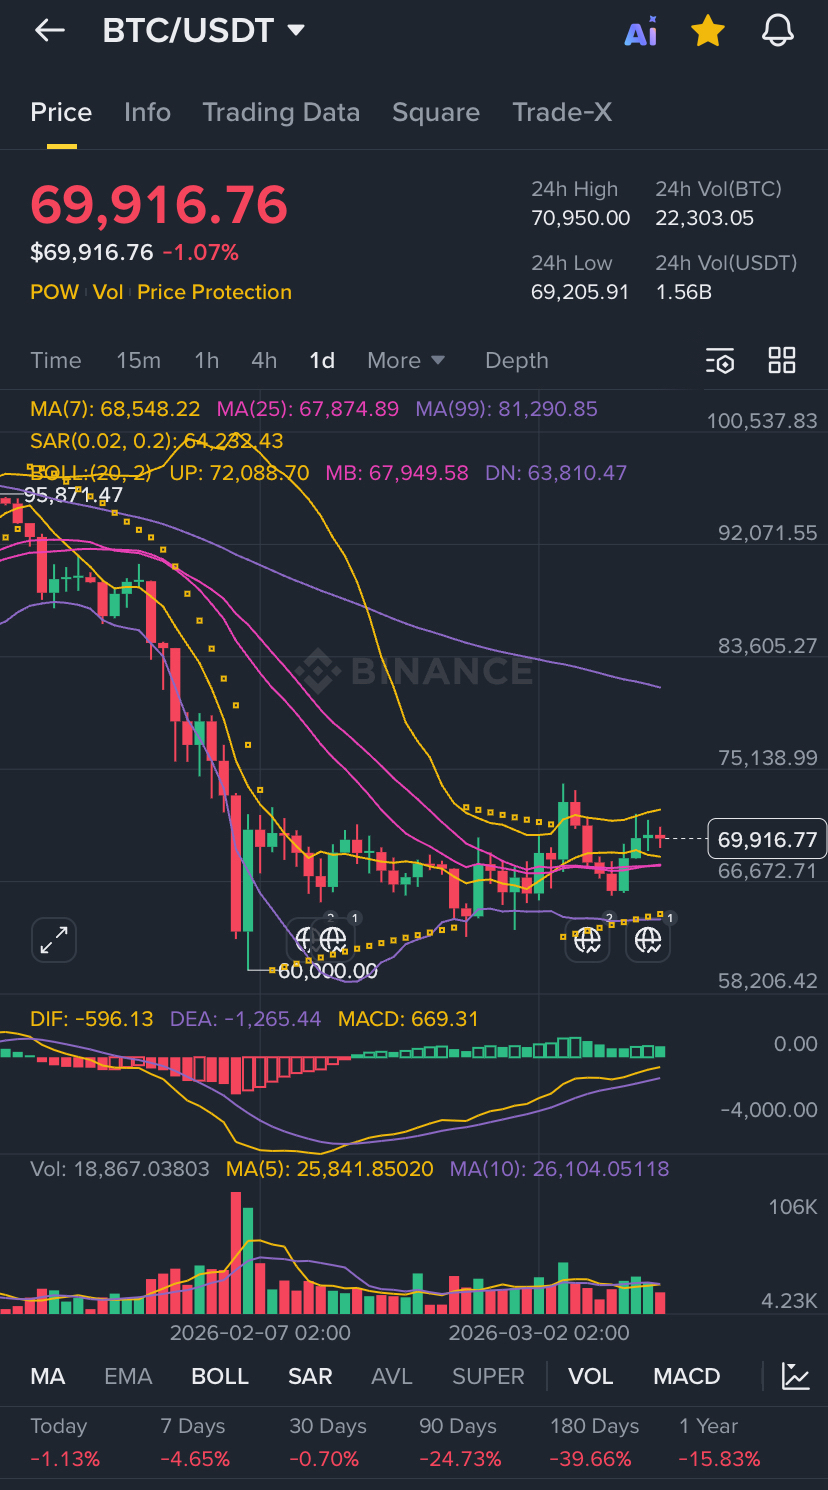
Price: ~69,916
Range forming between 66,500 – 72,000
After the big drop from ~95K → 60K, the market is now consolidating (sideways accumulation).
This often happens before the next major move.
2️⃣ Indicators Reading
Moving Averages
MA7 (68,548) above MA25 (67,874) → short-term #
#bullish
Price still below MA99 (~81K) → long-term trend still recovering
Bollinger Bands
Upper band: ~72,088
Middle band: ~67,949
Price is near the upper side, meaning pressure is building.
MACD
MACD turned positive
Momentum slowing slightly, meaning a breakout or rejection soon.
SAR
SAR dots below candles → bullish bias for now.
📈 Bullish Scenario
If BTC breaks 72,000 with strong volume:
Next targets:
74,500
78,000
81,000 (MA99 major resistance)
This would confirm trend reversal from the correction.
📉 Bearish Scenario
If BTC fails at 72K resistance:
Possible retrace to:
67,900 (middle Bollinger / MA support)
65,500
60,000 major support
60K is the strong structural support.
⚡ Most Probable Short-Term Move
Based on the tight consolidation + rising MACD:
➡️ BTC likely tests 72K resistance again soon.
Then either:
Breakout → fast move to 75K+
Fake breakout → drop back to 66–67K
✅ Key levels to watch
Resistance: 72,000
Support: 67,900
Major support: 60,000