Looking at the $BTC /USDT 4-hour chart, we are seeing some fascinating price action. After a volatile period, Bitcoin has reclaimed the $71,400 level, showing resilience despite broader global uncertainty.
Technical Breakdown:
* Support & Resistance: We’ve seen a solid bounce from the $62,510 floor. Current resistance sits at the recent local high of $74,050.
* Moving Averages: The price is currently fighting to stay above the MA(7) and MA(25), suggesting a tug-of-war between bulls and bears.
* Trend: The medium-term trend (MA 99) is still trending upward at $68,932, providing a strong safety net for the current price structure.
The "redemption trade" seems to be in full swing as Bitcoin decouples from traditional risk assets.
📉 Trading Signal: BTC/USDT (Long)
Based on the current momentum and the successful retest of moving average supports:
* Entry Zone: $71,400 - $71,500
* Take Profit (TP): $74,000 (Targeting the recent peak)
* Stop Loss (SL): $70,550
Strategy Note: Watch for a clean break above $72,000 to confirm the continuation. If we lose the $70k psychological level, the setup is invalidated.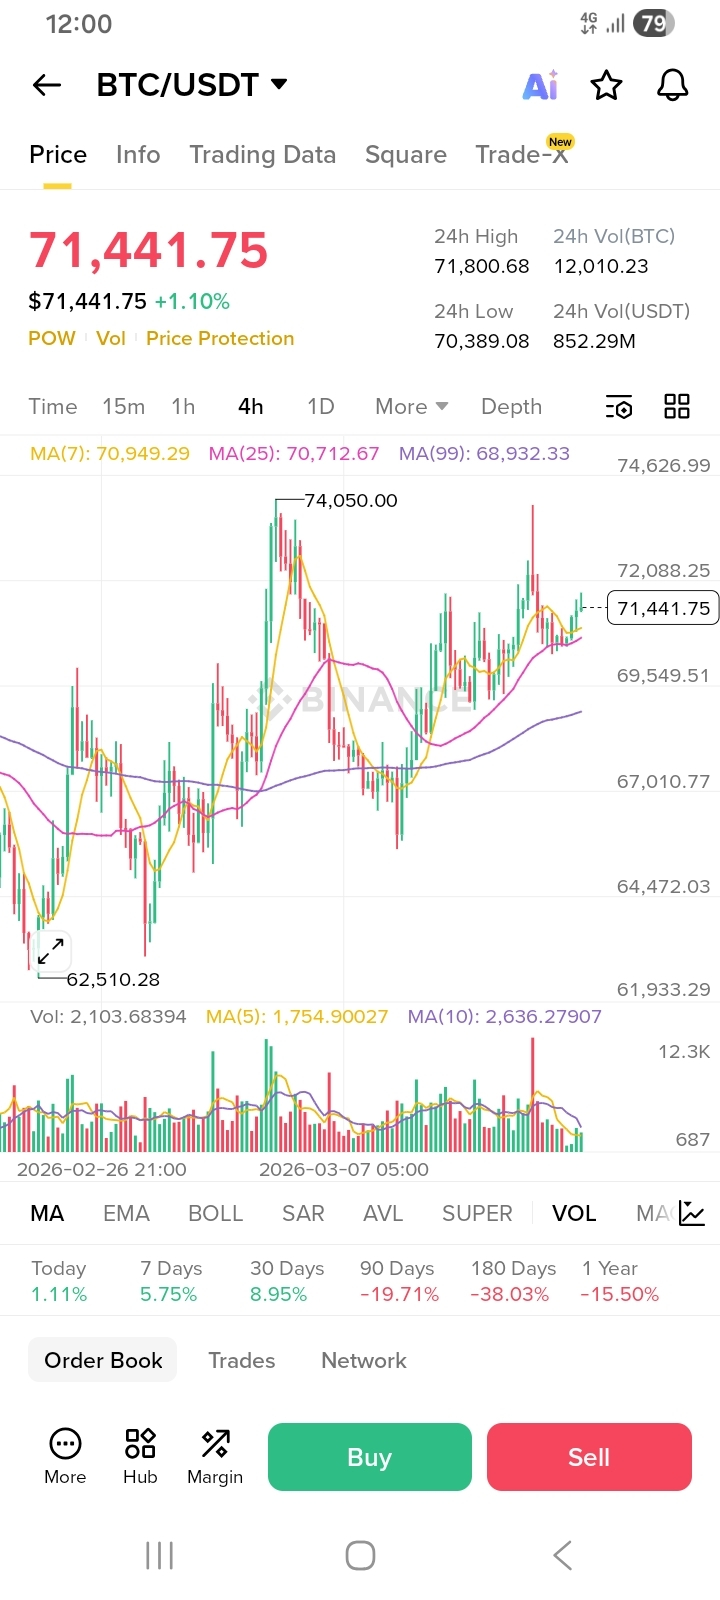
Trade safe, and always manage your risk! 🥂
$ETH $BNB #CryptoAnalysis #Bitcoin #TradingSignals #MarketUpdate