Looking at the $SOL daily chart, we are seeing a classic consolidation phase after a heavy correction. After hitting a low near $67.50, Solana is attempting to build a base around the $88 mark.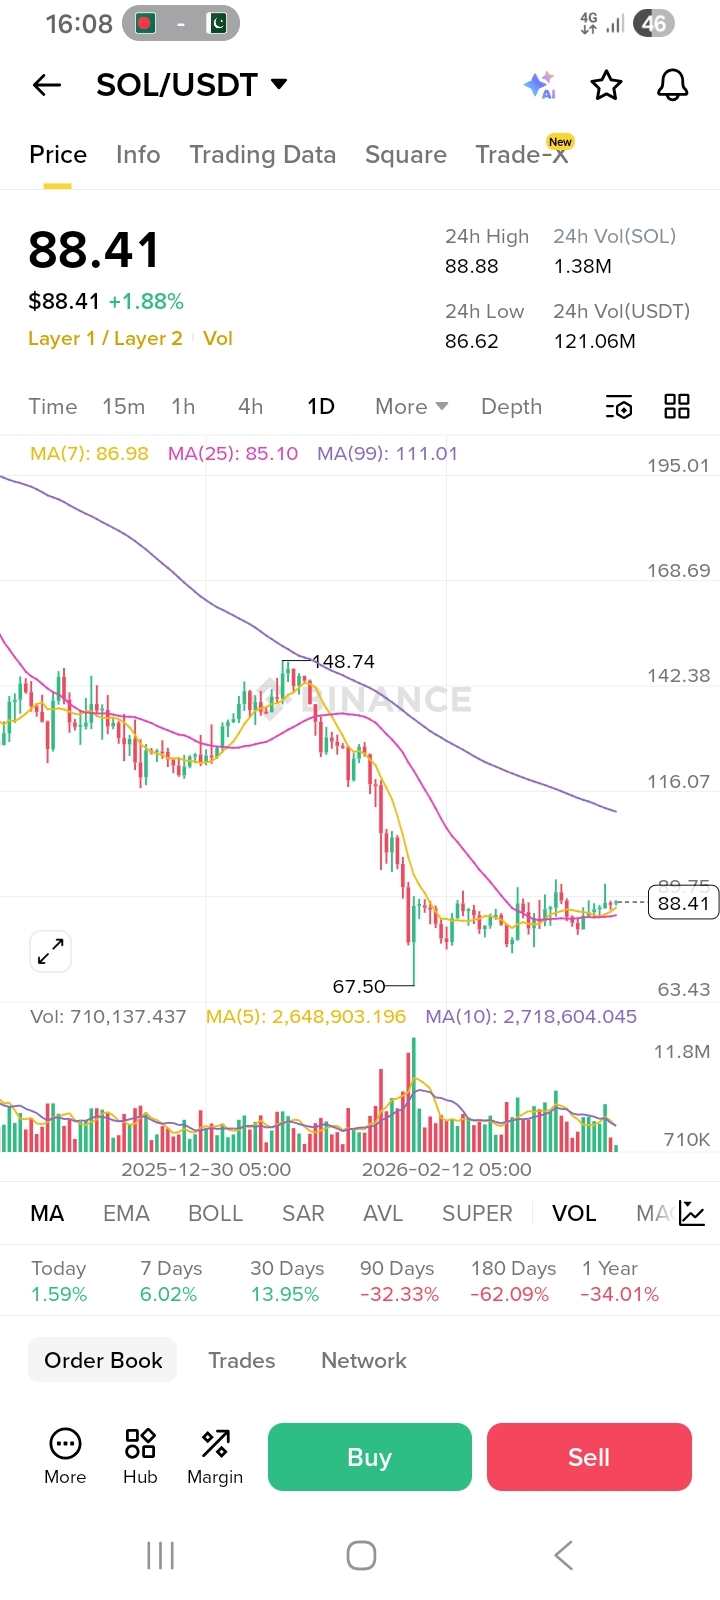
📉 Technical Breakdown:
* Trend: The price is currently trading below the 99-day MA (Purple), indicating a broader bearish trend, but we are seeing a short-term bullish crossover with the 7-day MA (Yellow) pushing above current price action.
* Support & Resistance: $67.50 is acting as a "floor," while $148.74 remains the major psychological resistance.
* Momentum: Recent daily candles show small bodies with rising volume, suggesting that the selling pressure is exhausting and buyers are stepping in at these discounted levels.
🟢 Trading Signal: BUY (Long)
Given the stabilization and the "Extreme Fear" sentiment in the broader market (often a contrarian buy signal), a long position offers a high-probability setup if the local support holds.
* Entry Price: $88.40 - $89.50
* Take Profit (Target): $115.00 (Major resistance level)
* Stop Loss: $79.50 (Below recent consolidation lows)
Market Sentiment:
The total market cap is recovering, and while $BTC and $BNB show some volatility, Solana’s on-chain activity remains a strong fundamental driver. Keep an eye on Bitcoin's dominance; if it cools off, SOL could lead the altcoin relief rally.
Always DYOR (Do Your Own Research). Trading involves risk.
#Solana #CryptoAnalysis #TradingSignals #BinanceSquare #Bullish2026