Technical Analysis: The Bottom Is In?
The daily (1D) chart shows that $MYX has undergone a massive correction, dropping over 96% from its peak near $7.60. However, the bleeding seems to have stopped.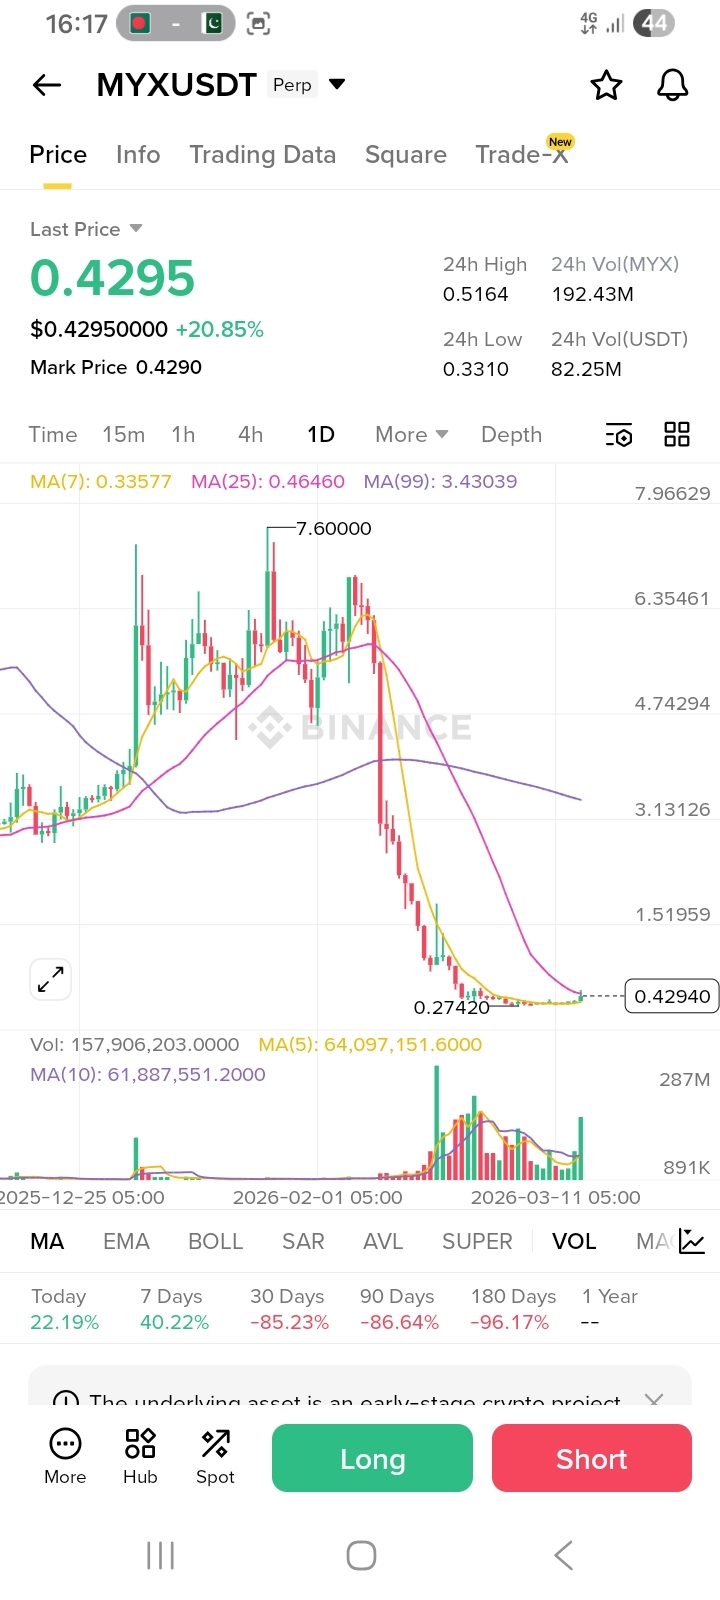
* Support Floor: The price has found strong horizontal support at the $0.2742 level, creating a "base" after months of selling.
* Momentum Shift: We are seeing a bullish recovery of +20.85% today. The price has successfully crossed above the MA(7) (Yellow line), indicating a short-term trend reversal.
* Volume Spike: There is a notable increase in buying volume at these lows, suggesting that "smart money" is accumulating for a relief rally.
Trading Signal: LONG (Buy)
This is a high-reward "Bottom Fishing" setup. We are targeting a recovery toward the next major resistance level.
* Entry Zone: $0.4200 – $0.4350
* Take Profit (TP): $0.9200 (Targeting the previous breakdown zone)
* Stop Loss (SL): $0.2650 (Just below the recent swing low)
Market Context
While $BTC and $BNB are showing stability, smaller cap projects like MYX are beginning to wake up. Always manage your risk, as early-stage projects carry higher volatility.
#MYX #CryptoTrading #TechnicalAnalysis #Bullish #BinanceSquare