Mastering Macro, On-Chain & Market Psychology (2026 Edition)
Most people in crypto only look at price charts.
But price is just the result.
If you want to stay ahead of the market, you must understand the three engines behind every move:
👉 Macro Liquidity
👉 On-chain Capital Flows
👉 Derivatives Market Psychology
This is the complete toolkit I personally use every day to read the market.
Save this thread.
This is your crypto trading manual.
CHAPTER 1 — MACRO DATA
Understanding Global Liquidity
Crypto is no longer a niche market.
Bitcoin now reacts to the same forces that move:
👉 S&P 500
👉 Bonds
👉 Dollar liquidity
👉 Central bank policy
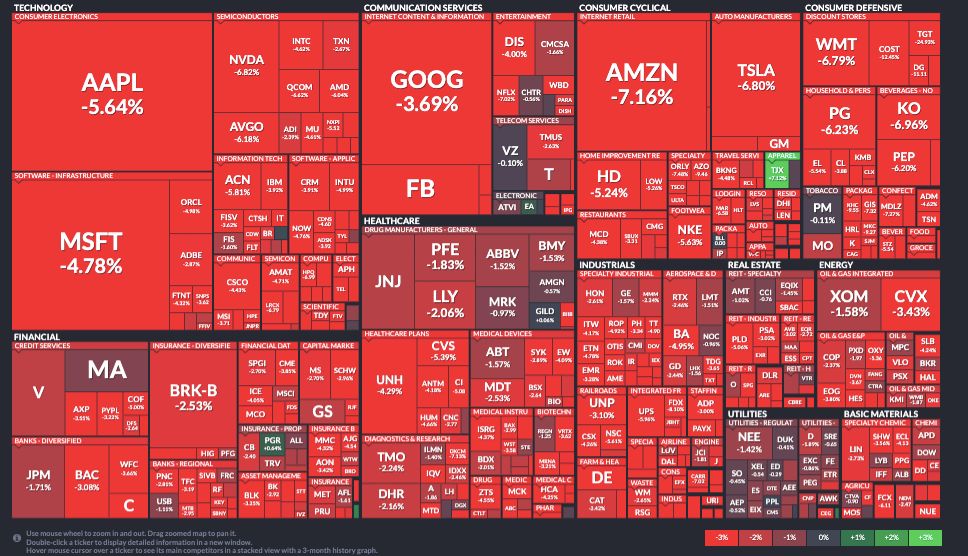
If you ignore macro, you are trading blind.
1.1 Economic Calendar
📊 Tools
👉 Investing.com
👉 Econoday
👉 ForexFactory 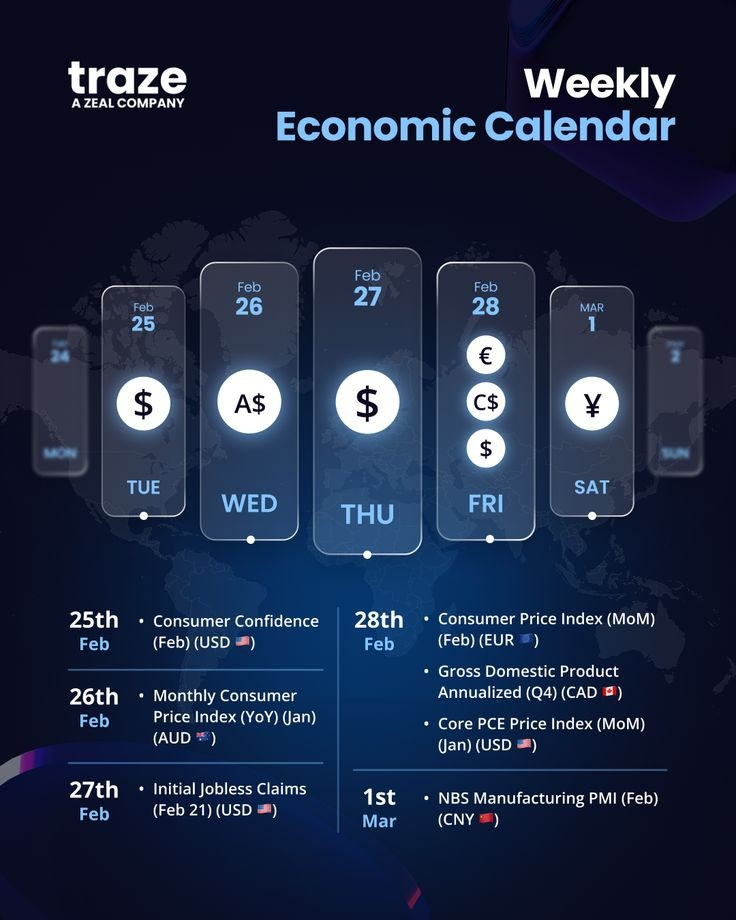
These calendars show the most important economic events.
Key indicators:
CPI (Consumer Price Index)
Measures inflation.
High CPI → Fed may raise interest rates → Risk assets drop.
Crypto usually reacts very violently to CPI surprises.
FOMC Meetings & Interest Rate Decisions
The most important macro event in global markets.
When the Fed increases rates:
Money moves from risk assets → bonds and cash.
That usually means:
• Stocks fall
• Crypto weakens
When the Fed cuts rates:
Liquidity expands.
Risk assets explode upward.
Non-Farm Payrolls (NFP)
Measures US employment.
Strong labor market = Fed can stay hawkish longer.
This often leads to temporary crypto weakness.
Strategy
Every Sunday or Monday, check the economic calendar.
If major events are coming:
• reduce leverage
• close risky trades
• prepare for volatility
Macro days can liquidate both sides of the market.
1.2 US Dollar Index (DXY)
📊 Tool
👉 TradingView
Ticker: DXY
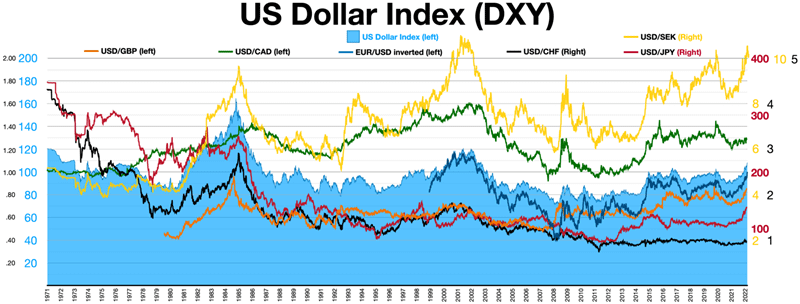
The US Dollar is the global liquidity gauge.
Bitcoin and DXY often move in opposite directions.
DXY Rising
Investors seek safety.
Liquidity tightens.
Risk assets drop.
Crypto weakens.
DXY Falling
Liquidity expands.
Investors chase risk.
Crypto becomes attractive.
Bull markets usually start when DXY trends downward.
1.3 Global Liquidity Indicators
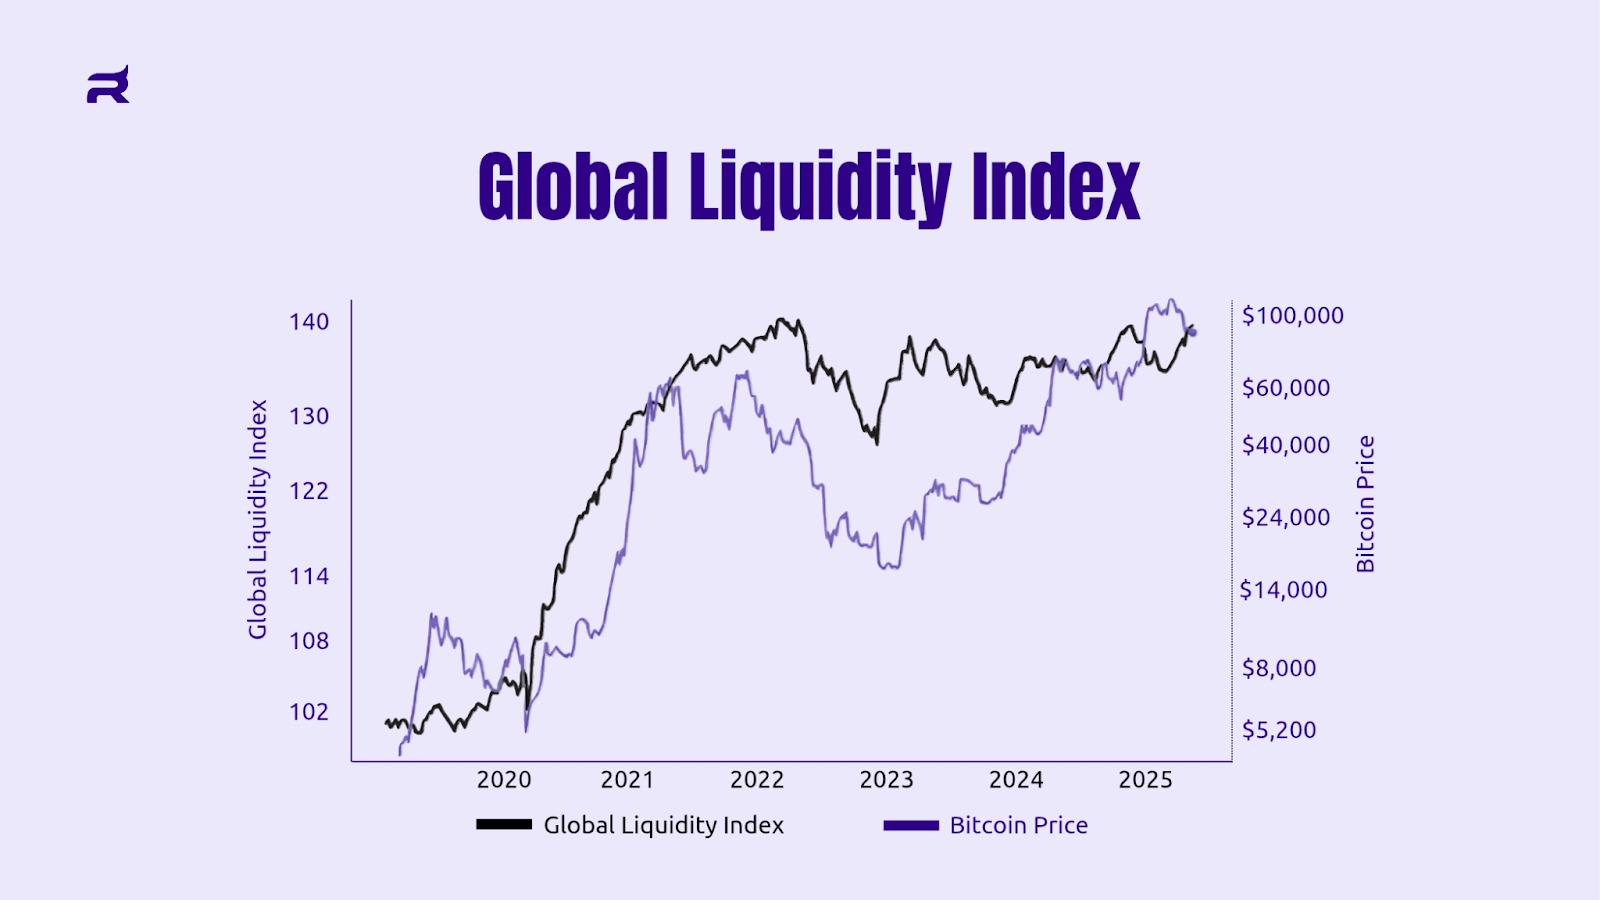
Advanced traders monitor liquidity expansion.
Key indicators:
👉 Global M2 Money Supply
👉 US Treasury liquidity
👉 Reverse Repo levels
👉 Central Bank balance sheets
Tools:
👉 TradingView
👉 MacroMicro
👉 FRED (Federal Reserve database)
When global liquidity expands, crypto usually enters bull cycles.
CHAPTER 2 — ON-CHAIN ANALYSIS

Tracking the Money of the Whales
Traditional markets hide data.
Crypto is different.
Every transaction is public and transparent.
Whales cannot hide their capital flows.
2.1 Exchange Flows
Tools:
👉 CryptoQuant
👉 Glassnode
👉 Nansen
Key metrics:
Exchange Reserve
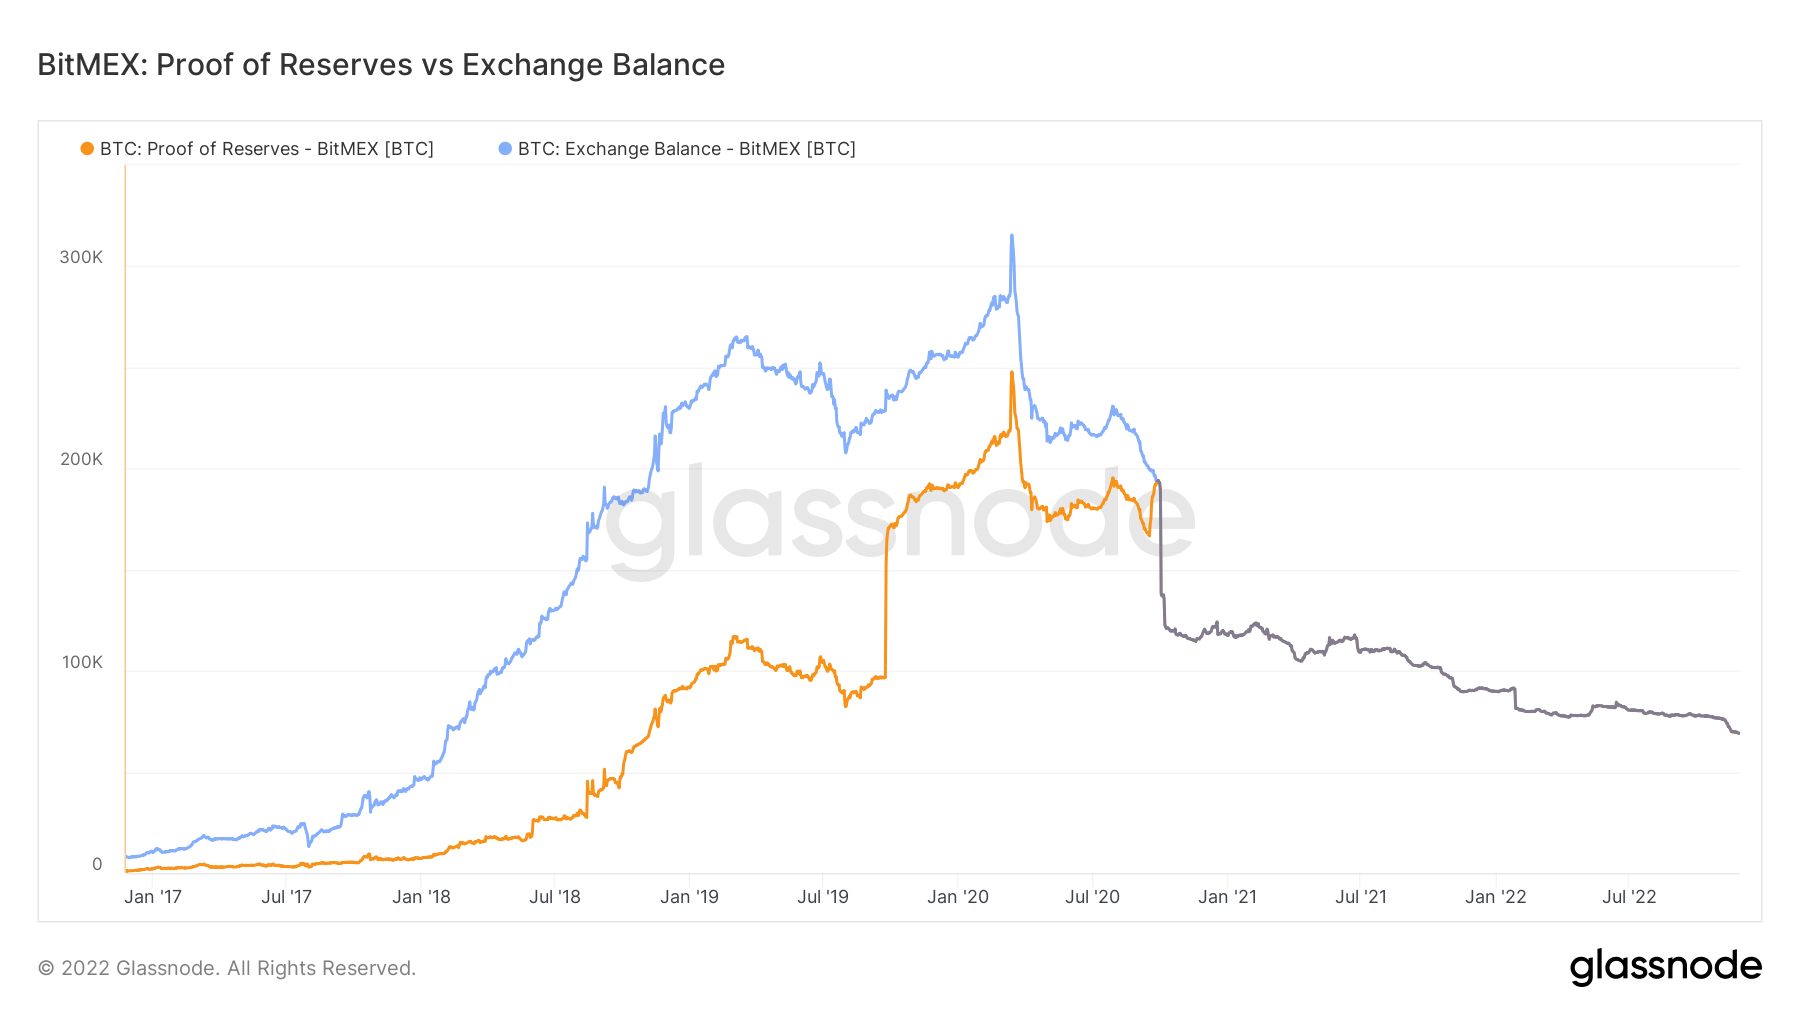
Amount of BTC held on exchanges.
When reserves drop:
Investors move BTC to cold wallets.
This signals long-term holding.
Bullish.
When reserves increase:
Coins move to exchanges.
Potential selling pressure.
Bearish.
Netflow
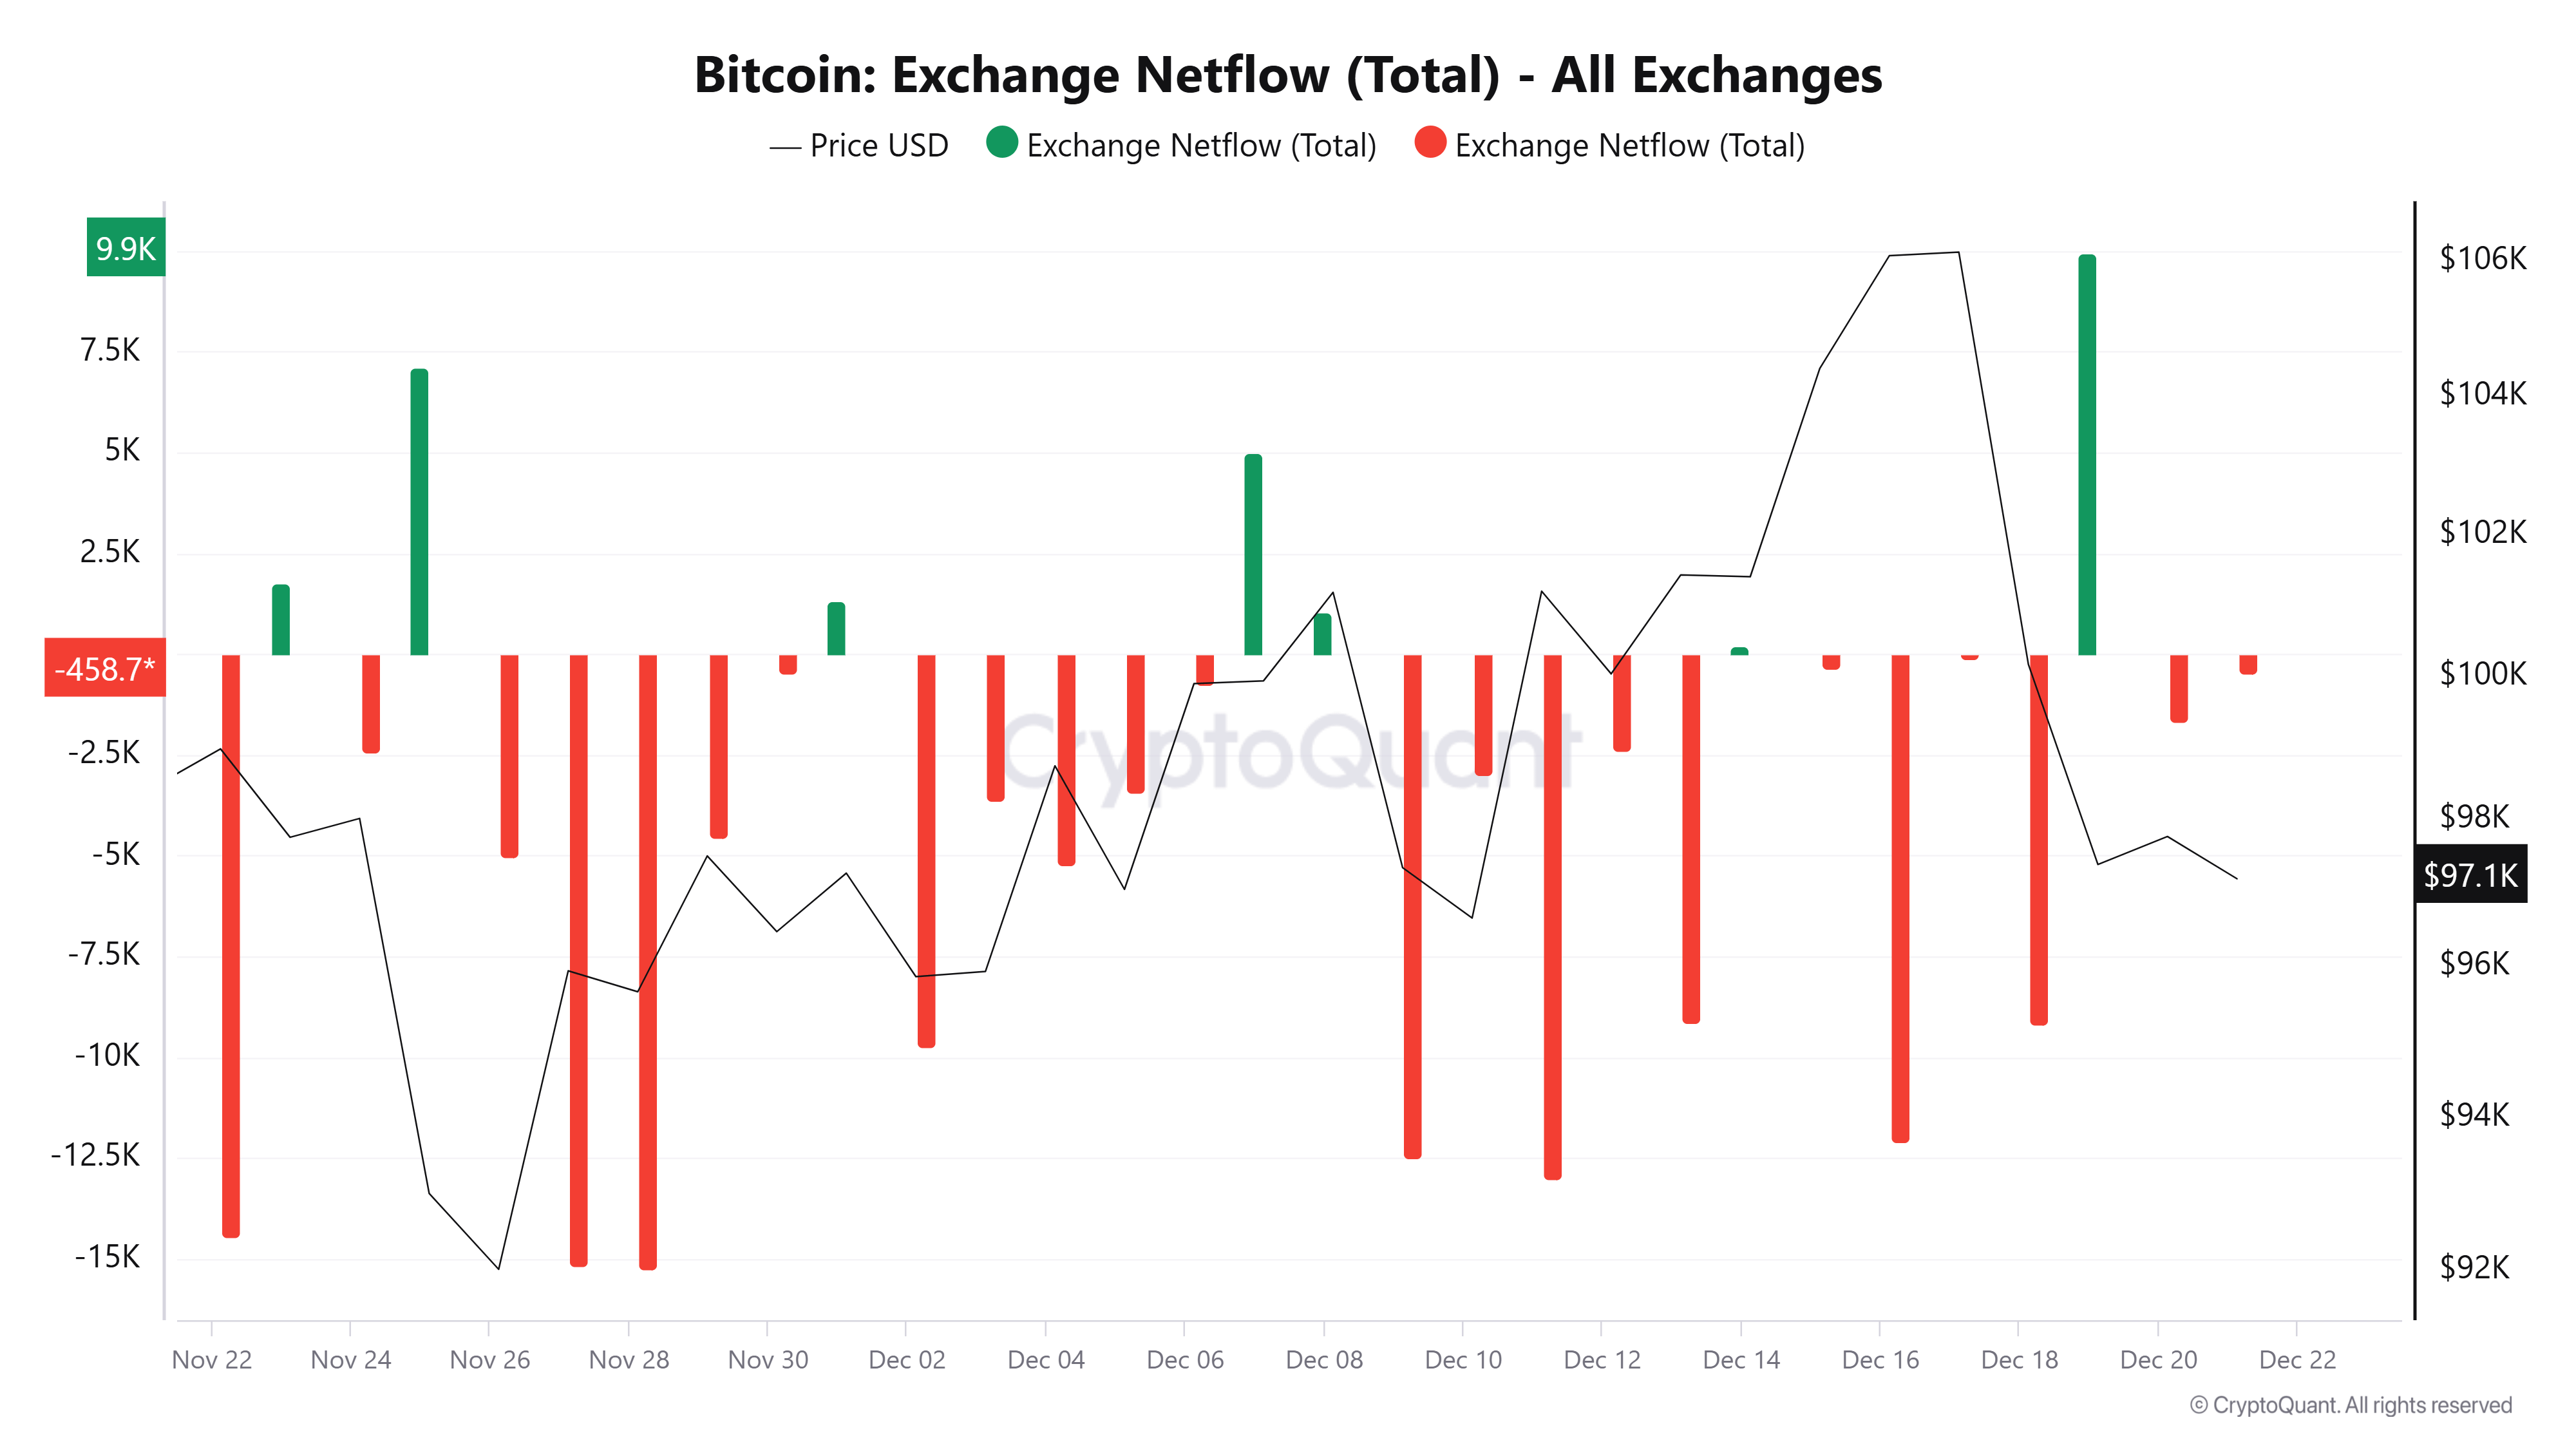
Measures the net inflow/outflow of crypto to exchanges.
Large inflows → possible dump.
Large outflows → accumulation.
Stablecoin Inflows
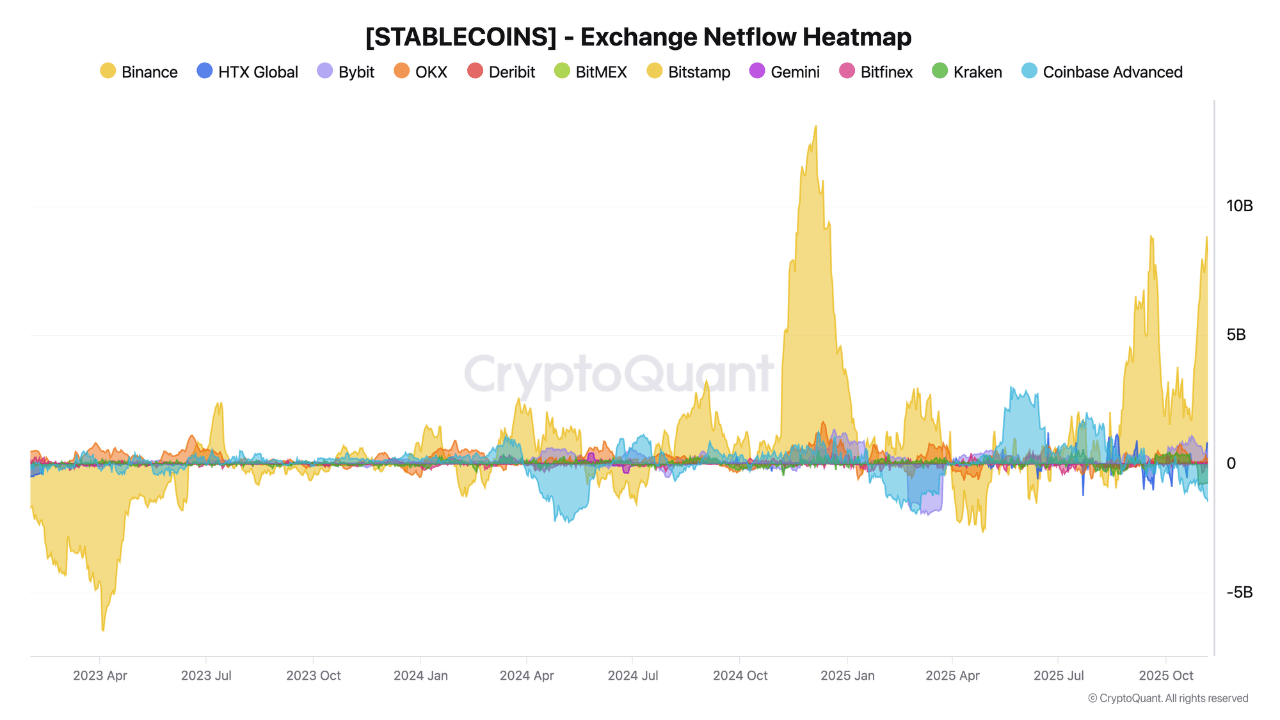
Stablecoins are fuel for bull markets.
When large amounts of:
• USDT
• USDC
• DAI
move to exchanges, it often signals buying pressure coming.
2.2 Whale Tracking
Tools:
👉 Arkham Intelligence
👉 Whale Alert
👉 Nansen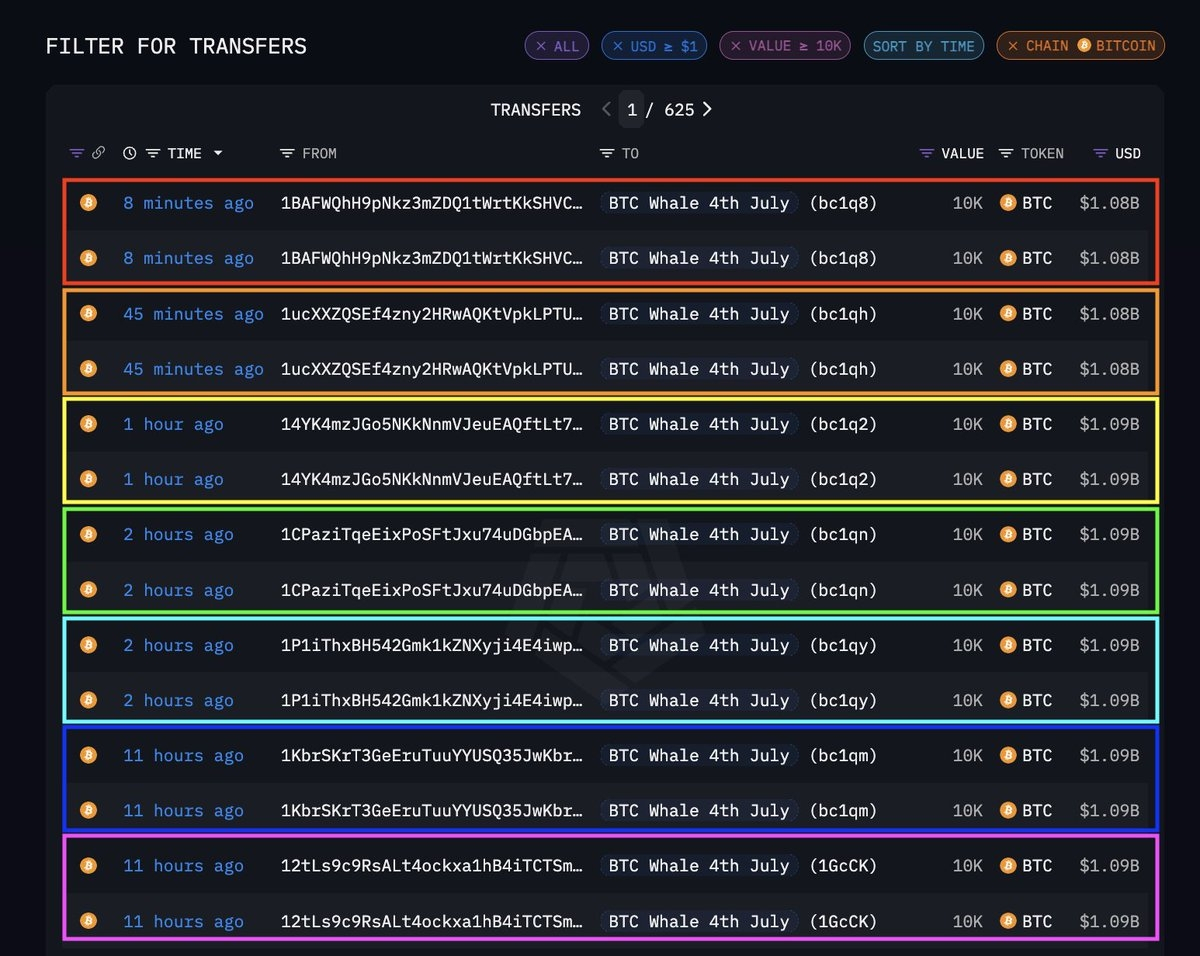
Whales move markets.
Monitoring large wallets helps you see big moves before retail does.
Example:
If an old wallet suddenly moves 10,000 BTC to Binance, it could mean:
• large sell orders
• market volatility ahead
But if whales move BTC off exchanges, they may be accumulating.
2.3 Long-Term Holder Metrics
Glassnode provides powerful metrics.
Important ones:
Long Term Holder Supply
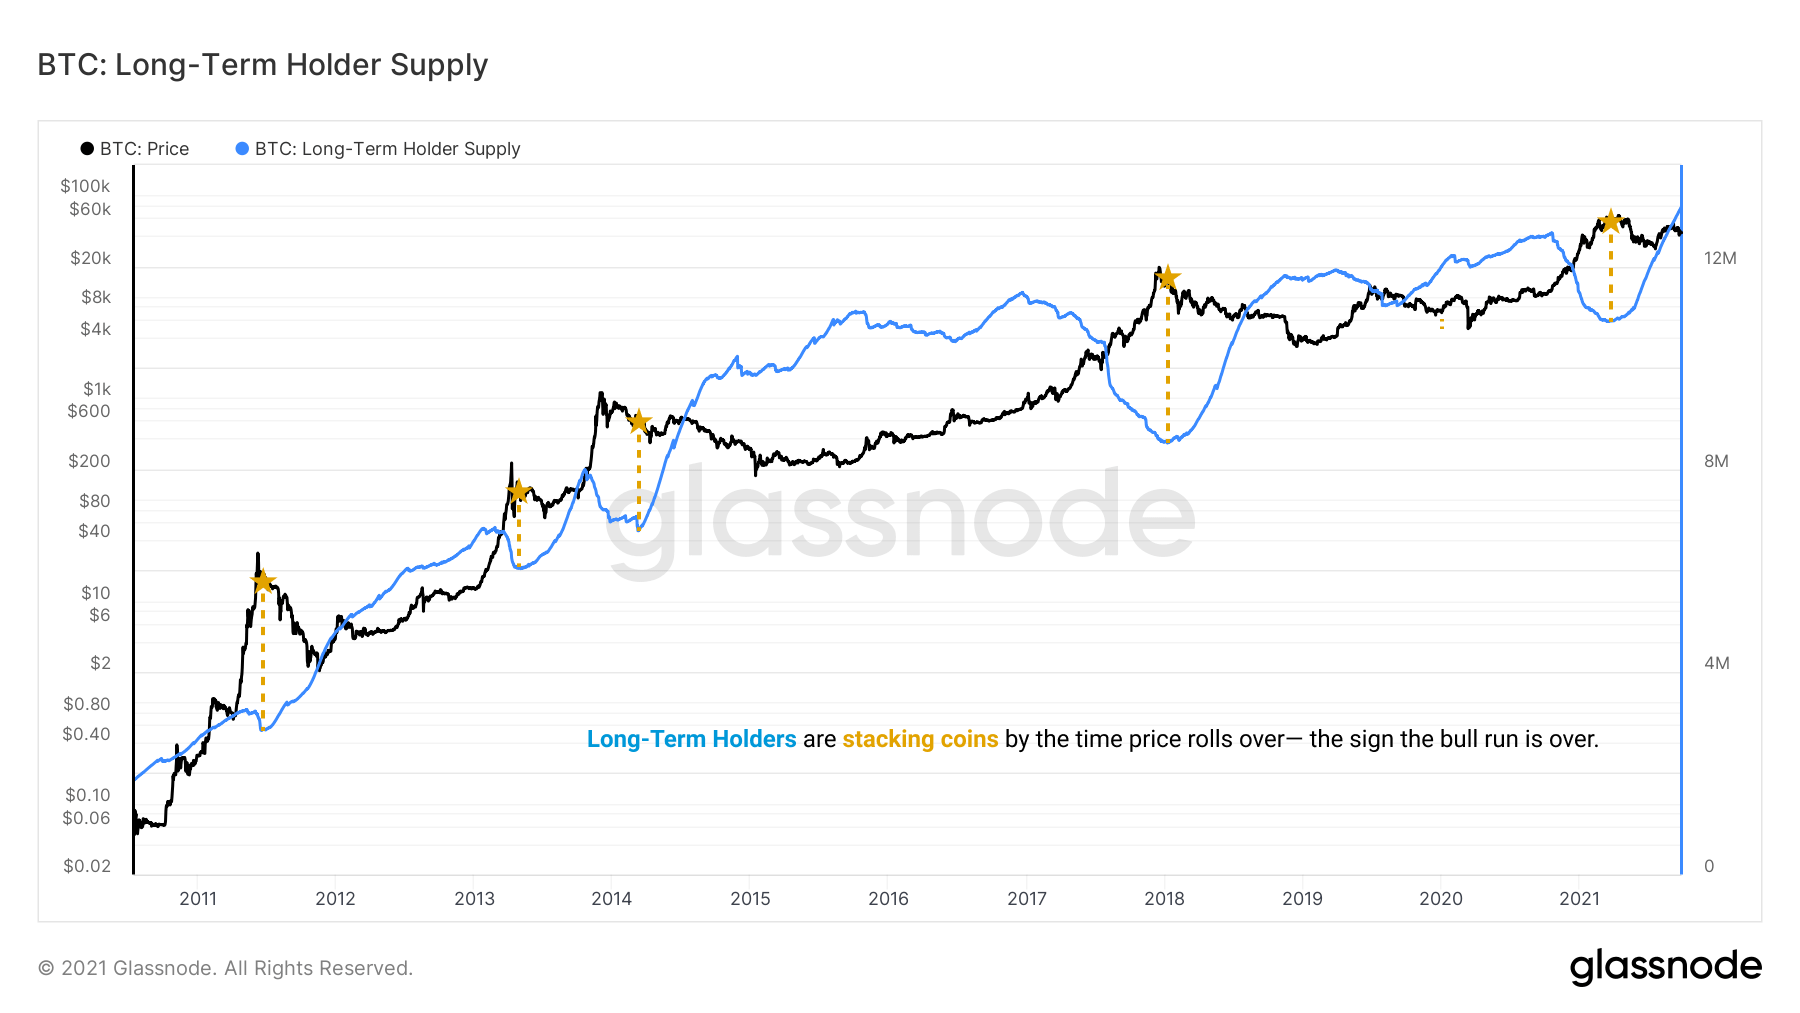
Measures how much BTC is held by investors holding >155 days.
When LTH supply increases:
Market is in accumulation phase.
Realized Price
Average price at which coins last moved.
Markets often find strong support near realized price levels.
CHAPTER 3 — DERIVATIVES DATA
Reading Market Psychology
Spot markets move slowly.
Futures markets reveal trader sentiment in real time.
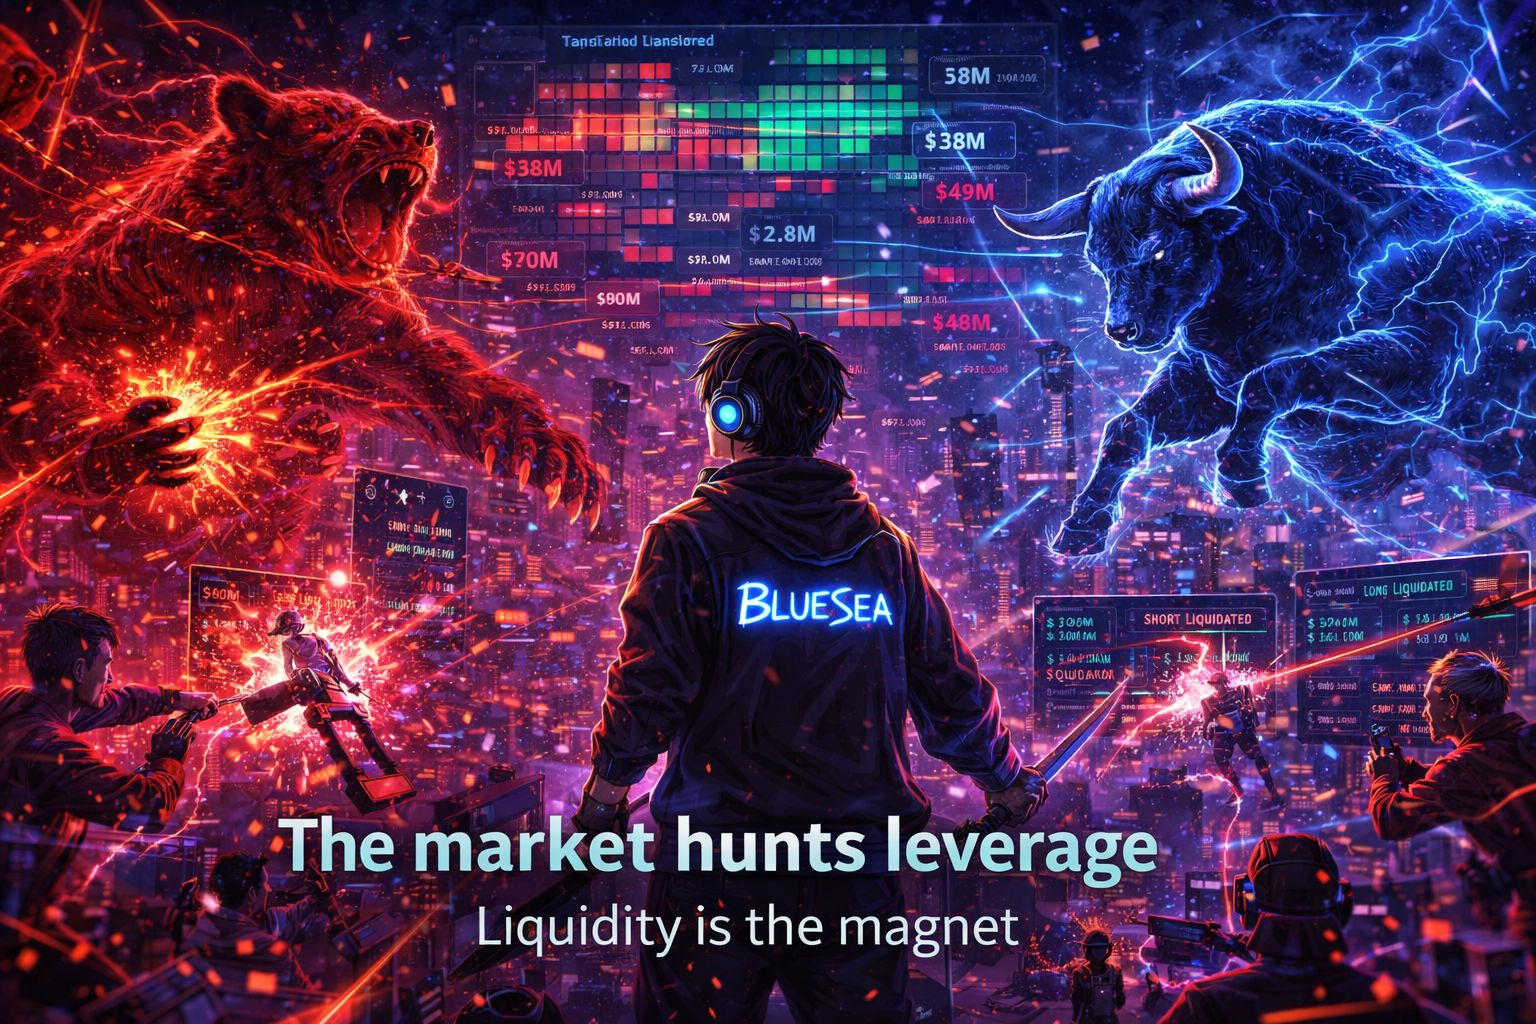
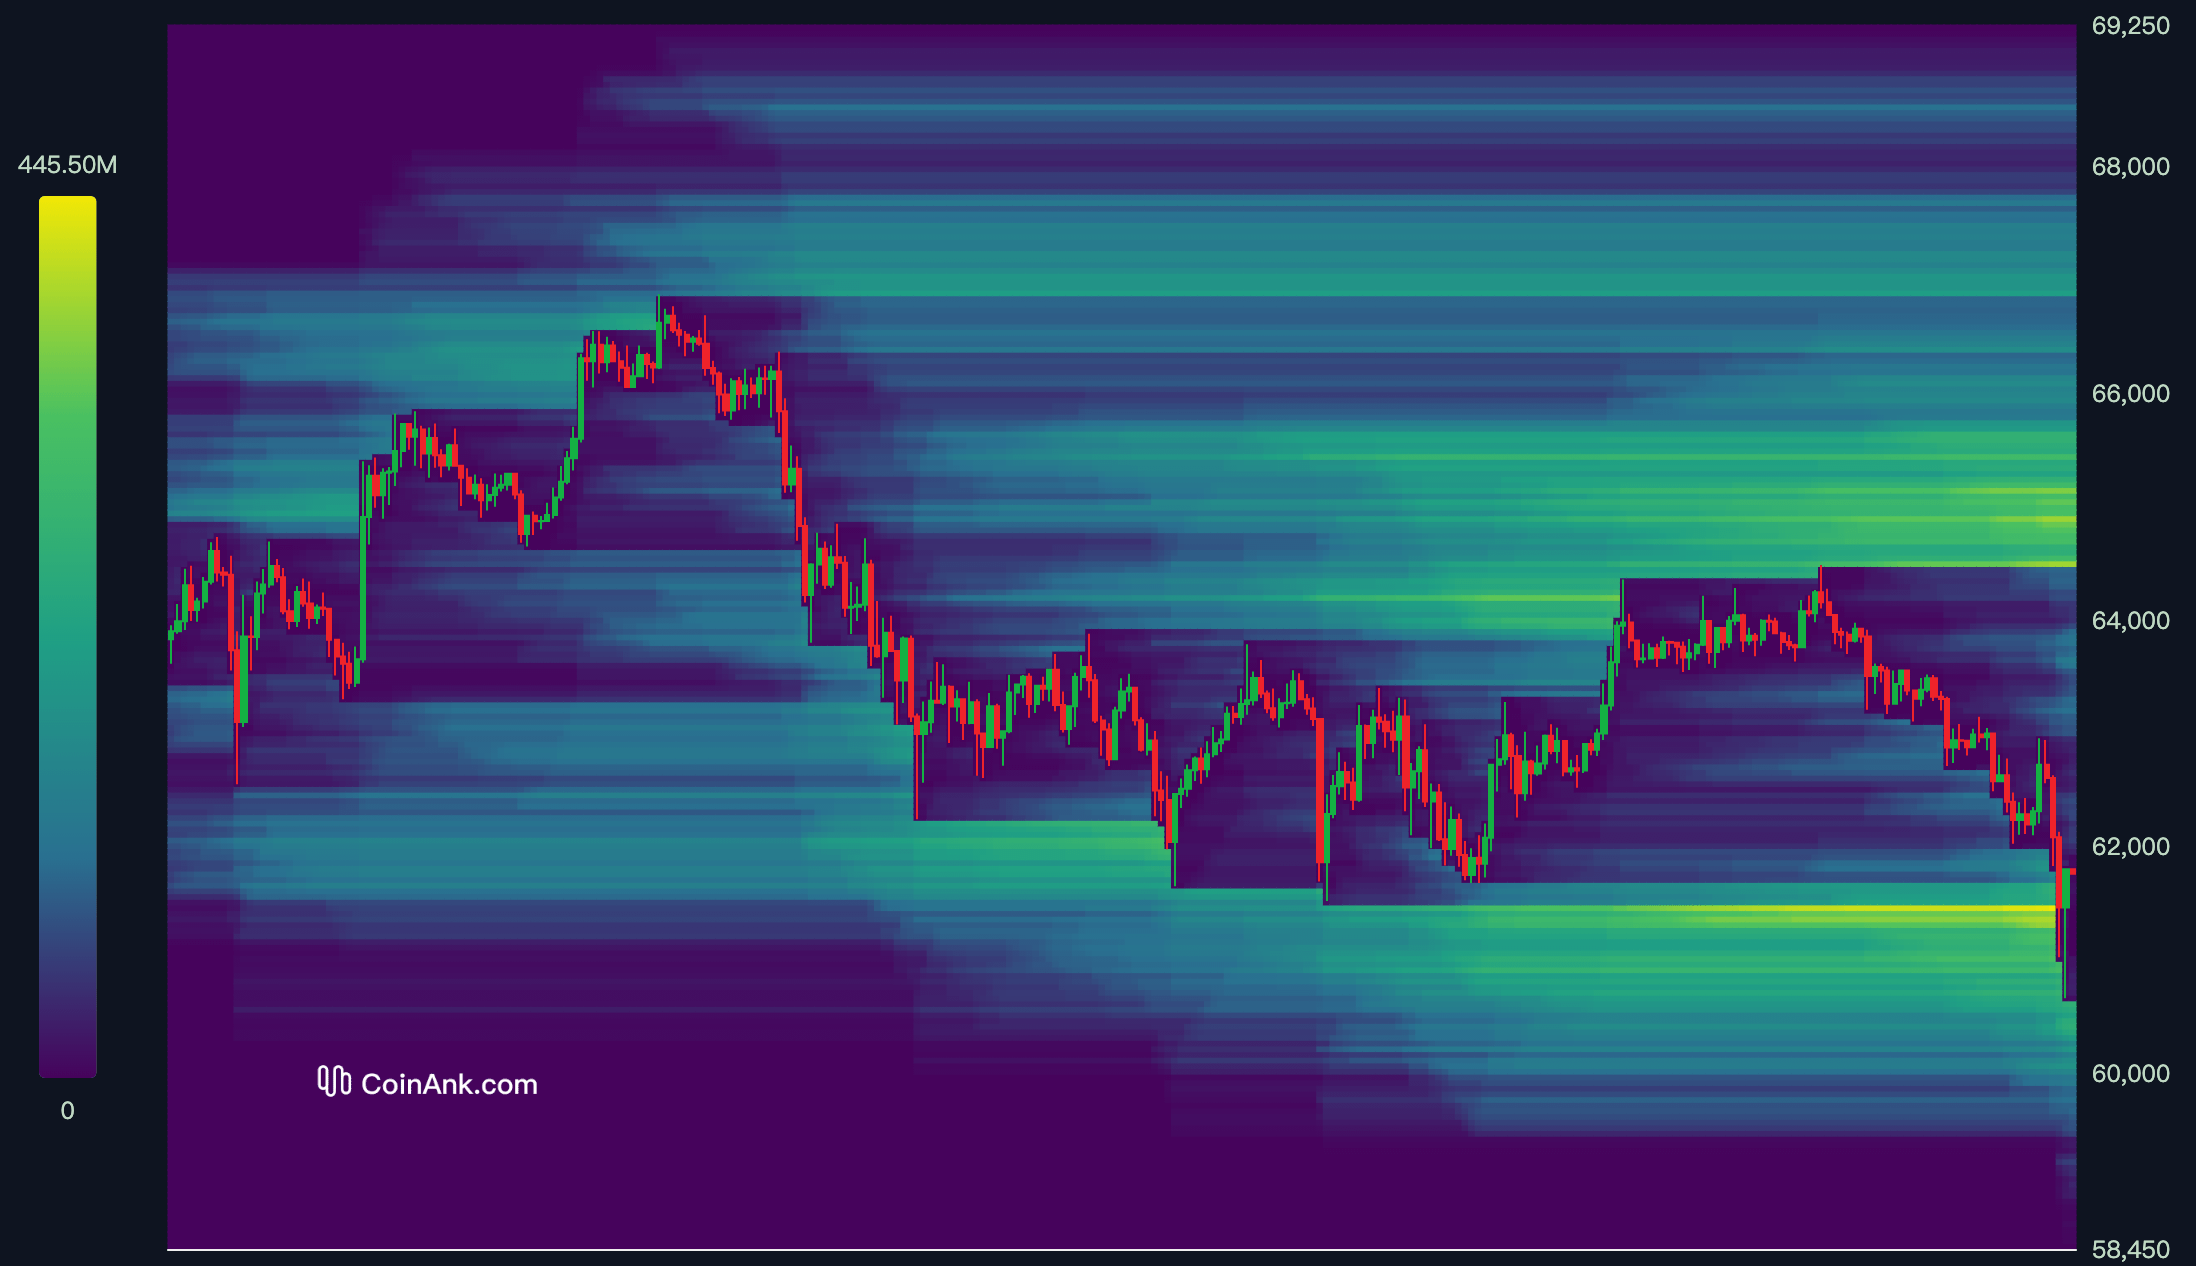
3.1 Liquidation Heatmaps
Tool:
👉 Coinglass
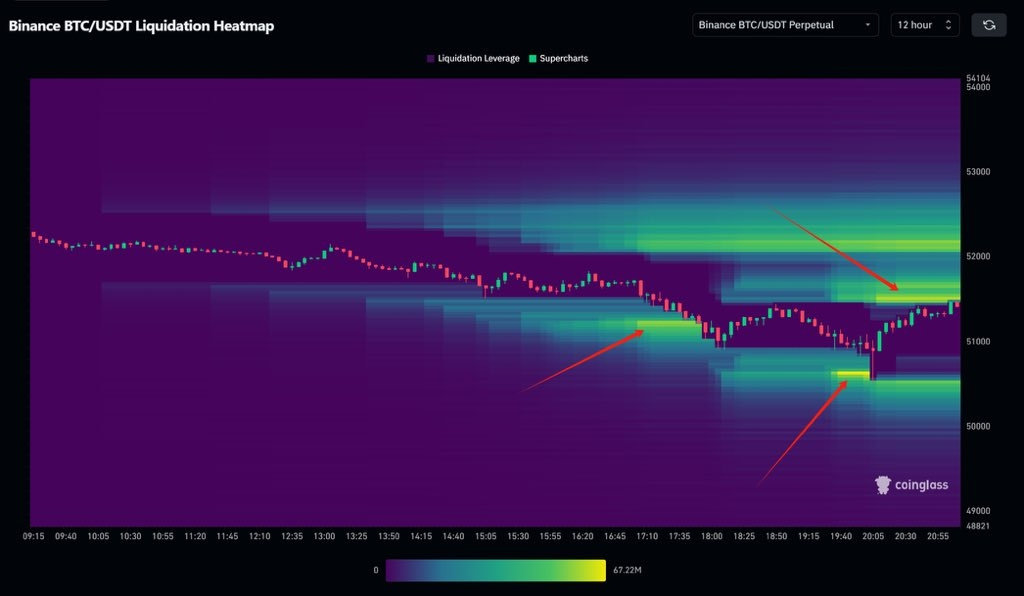
This shows where traders will get liquidated.
Markets often move toward liquidity zones.
Why?
Because large players profit from forced liquidations.
Price acts like a magnet toward leverage clusters.
3.2 Funding Rate
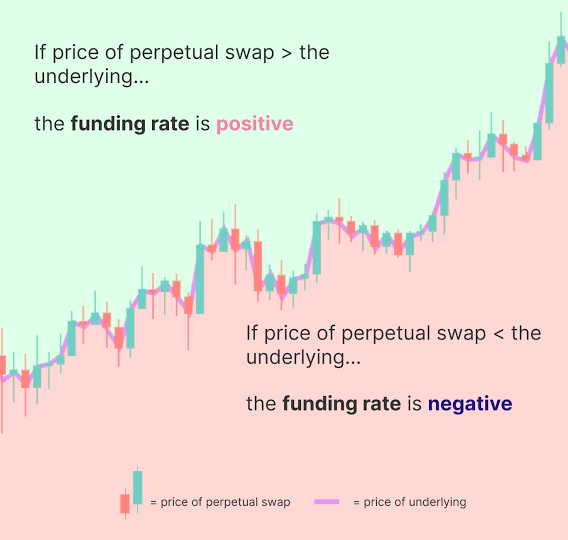
Funding shows the balance between longs and shorts.
Positive Funding
Too many traders long.
Market becomes crowded.
Risk of long squeeze increases.
Negative Funding
Too many traders short.
Market can trigger short squeeze pumps.
Smart traders use funding extremes as contrarian signals.
3.3 Open Interest
Tool:
👉 Coinglass
👉 Glassnode
Open Interest measures total leveraged positions.
When OI increases rapidly without spot demand:
Market becomes fragile.
Large liquidations are likely.
CHAPTER 4 — SENTIMENT & SOCIAL DATA
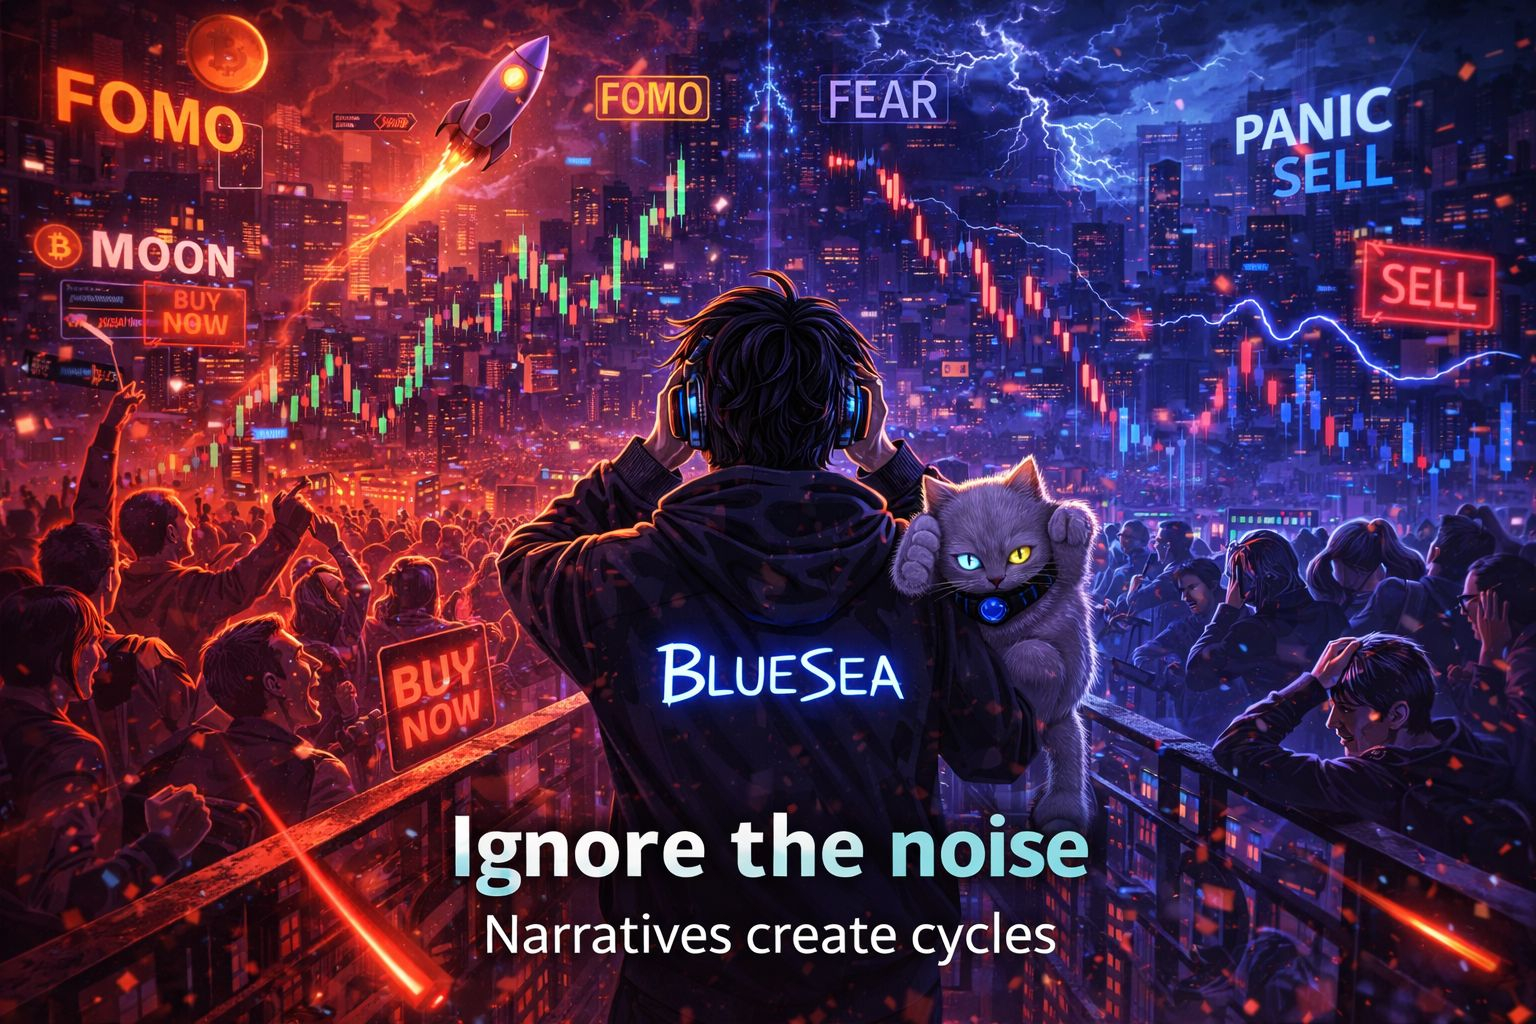
Markets move on narratives.
Tracking sentiment helps identify crowd psychology.
Tools:
👉 LunarCrush
👉 Santiment
👉 Google Trends
👉 Twitter / X sentiment
When retail becomes extremely bullish, markets often top.
When fear dominates, bottoms form quietly.
CHAPTER 5: LIQUIDITY & MARKET STRUCTURE
Understanding Where Price Wants To Go
Most retail traders believe price moves randomly.
It doesn’t.
Price moves toward liquidity.
In every market — Forex, Stocks, Crypto — large players need liquidity to enter and exit positions.
And liquidity is usually located where retail traders place their stop losses.
Understanding this concept alone can completely change the way you see the market.
5.1 Liquidity Pools — Where Stop Losses Live
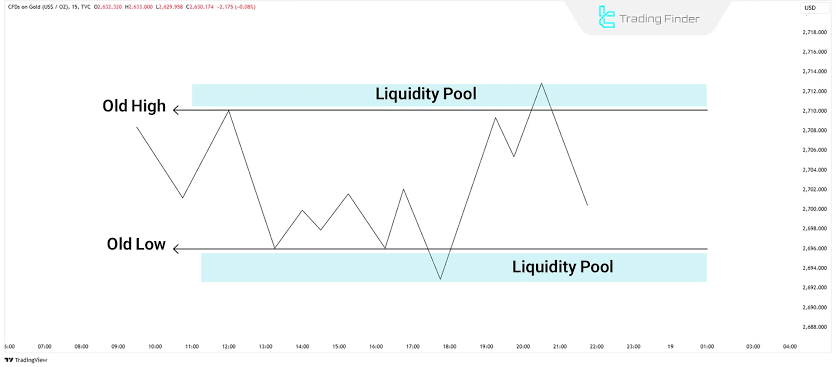
Liquidity pools are areas where a large number of stop losses are concentrated.
Common locations include:
• Above equal highs
• Below equal lows
• Above resistance levels
• Below support levels
Why?
Because retail traders are taught to place stop losses there.
When price breaks these levels, it often triggers a cascade of liquidations.
This is known as a liquidity sweep.
And this is exactly where smart money often enters the opposite position.
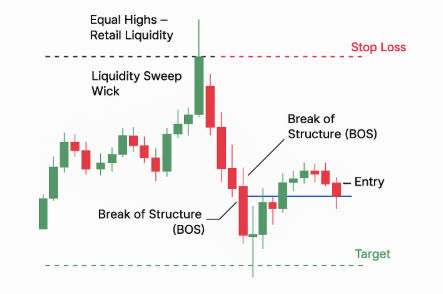
5.2 Liquidity Sweeps — The Market's Favorite Trap
A liquidity sweep happens when price briefly moves beyond a key level to trigger stop losses before reversing direction.
You have probably experienced this before:
You enter a trade.
Price hits your stop loss.
Then immediately moves in your original direction.
This is not bad luck.
This is market structure doing its job.
The market must take liquidity before it can move.
Key signs of a liquidity sweep:
• Fake breakout above resistance
• Fake breakdown below support
• Long wicks on candles
• Sudden spike in volume
Professional traders look for these sweeps before entering trades.
Retail traders usually become the liquidity.
5.3 Fair Value Gap (FVG) — The Market Inefficiency 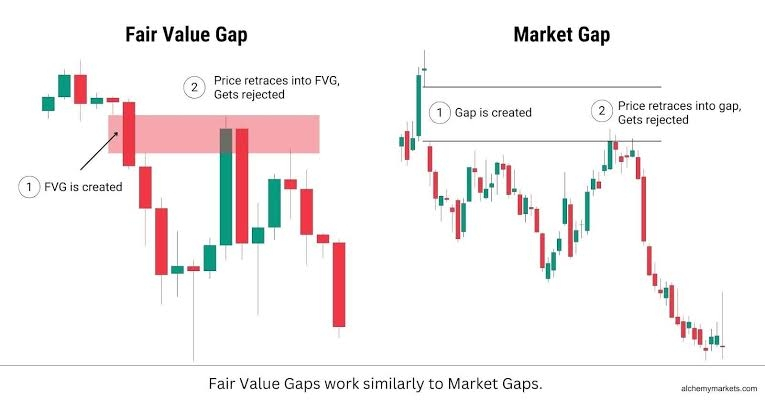
When price moves aggressively in one direction, it often leaves behind an inefficient price zone.
This is called a Fair Value Gap (FVG).
It happens when there is an imbalance between buyers and sellers.
Example structure
Markets often return to these gaps to rebalance liquidity.
This is why you often see price:
Pump violently → retrace → then continue.
That retracement is often filling an FVG.
Many professional traders use these zones as high probability entry areas.
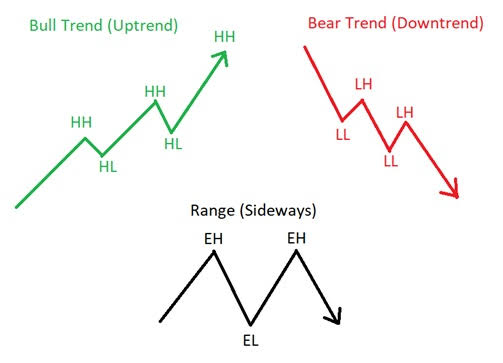
5.4 Market Structure — The Map of the Trend
Understanding liquidity is powerful.
But it becomes even stronger when combined with market structure.
The market moves in repeating patterns:
Uptrend structure
Higher High (HH)
Higher Low (HL)
Downtrend structure
Lower High (LH)
Lower Low (LL)
When structure breaks, the trend often changes.
This is called Market Structure Break (MSB).
Example:
HH → HL → HH → HL
trend intact
HH → HL → BREAK BELOW HL
trend change
Liquidity sweeps often occur right before these structural shifts.
5.5 The Reality of the Market
Most traders think the market is about predicting direction.
In reality, it is about understanding where liquidity sits.
Price does not move randomly.
It moves between liquidity zones.
From one cluster of stop losses to another.
🔵 Bluesea Insight
Charts are not random lines.
They are a battlefield.
Every candle represents:
👉Fear
👉Greed
👉Liquidations
👉Trapped traders
Retail traders chase price.
Smart traders wait where liquidity must be taken.
And when you finally understand this…
You stop asking:
"Where will price go?"
Instead you ask:
"Where is the liquidity?"
And suddenly the market starts to make sense.
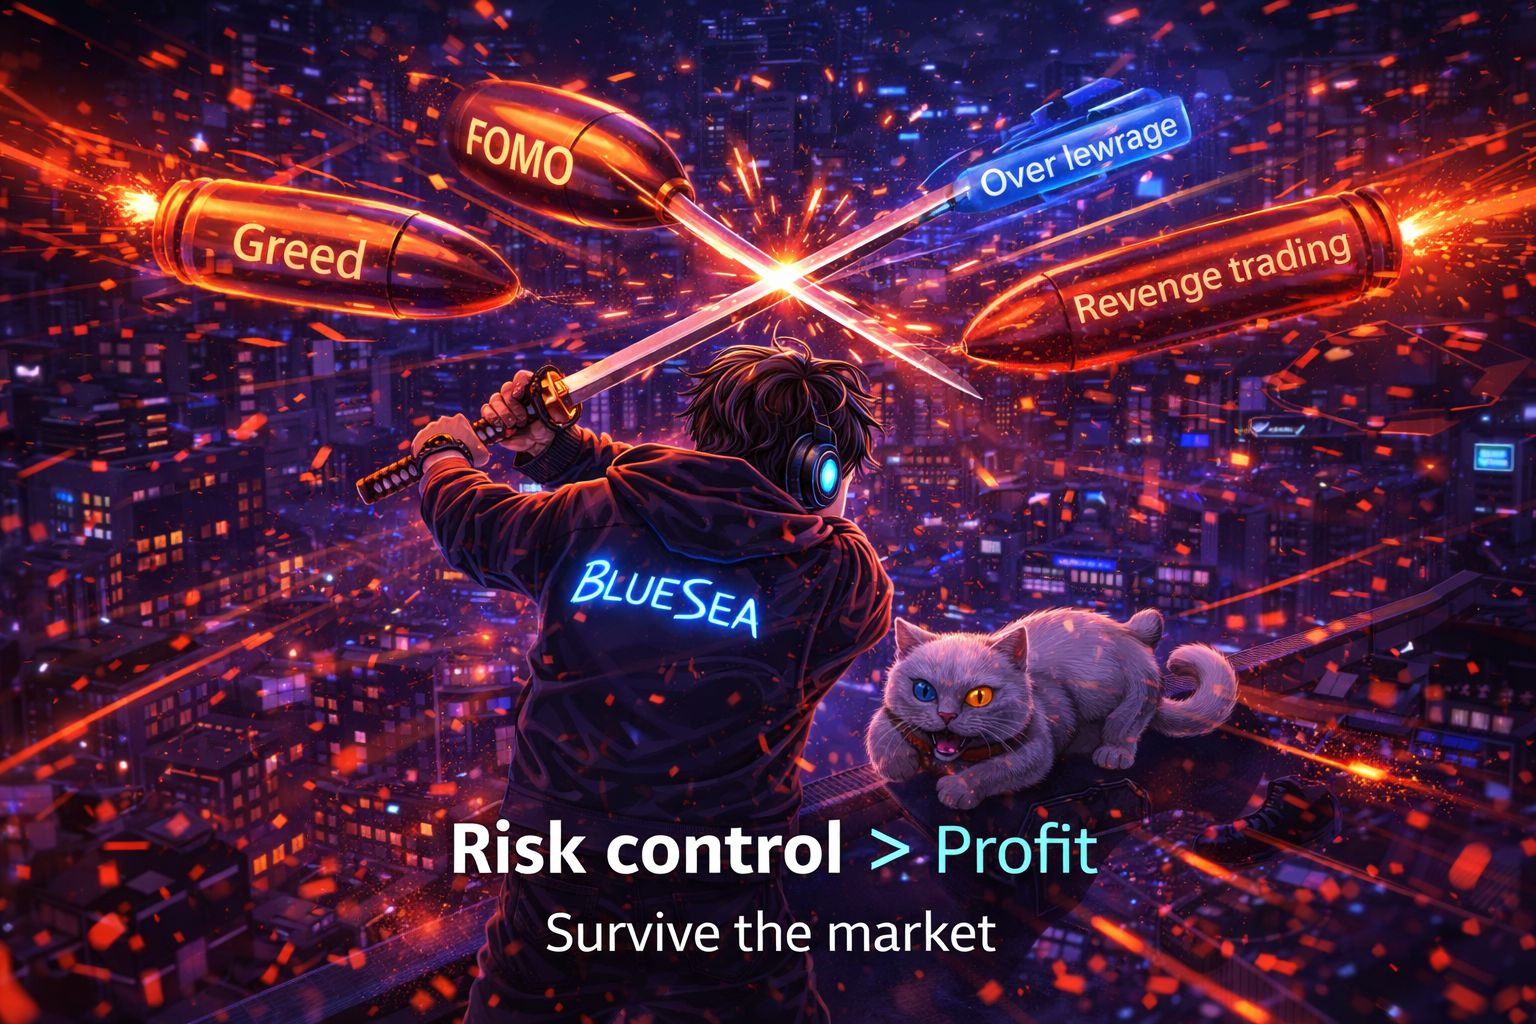
CHAPTER 6 — RISK MANAGEMENT
Even the best traders lose trades.
The difference is risk control.
Golden rules:
• Never risk more than 1-2% per trade
• Always use stop losses
• Avoid high leverage during macro events
• Do not revenge trade
Survival in crypto is more important than winning trades.
🧠 FINAL WORDS
Charts show price.
On-chain shows money.
Macro shows liquidity.
But none of these matter without discipline.
Tools are weapons.
But your mind is the warrior.
Sometimes the best trade is not trading at all.
In chaotic markets, patience is the real edge.
🥳Thank you for taking the time to read this guide.
If this post helped you see the market with more clarity, then it has done its job.
Remember — in crypto, survival comes before profit.
Stay patient. Stay disciplined.
See you on the charts.
Bluesea🐱
$BTC $ETH #tradingtips #BinanceSquareFamily
