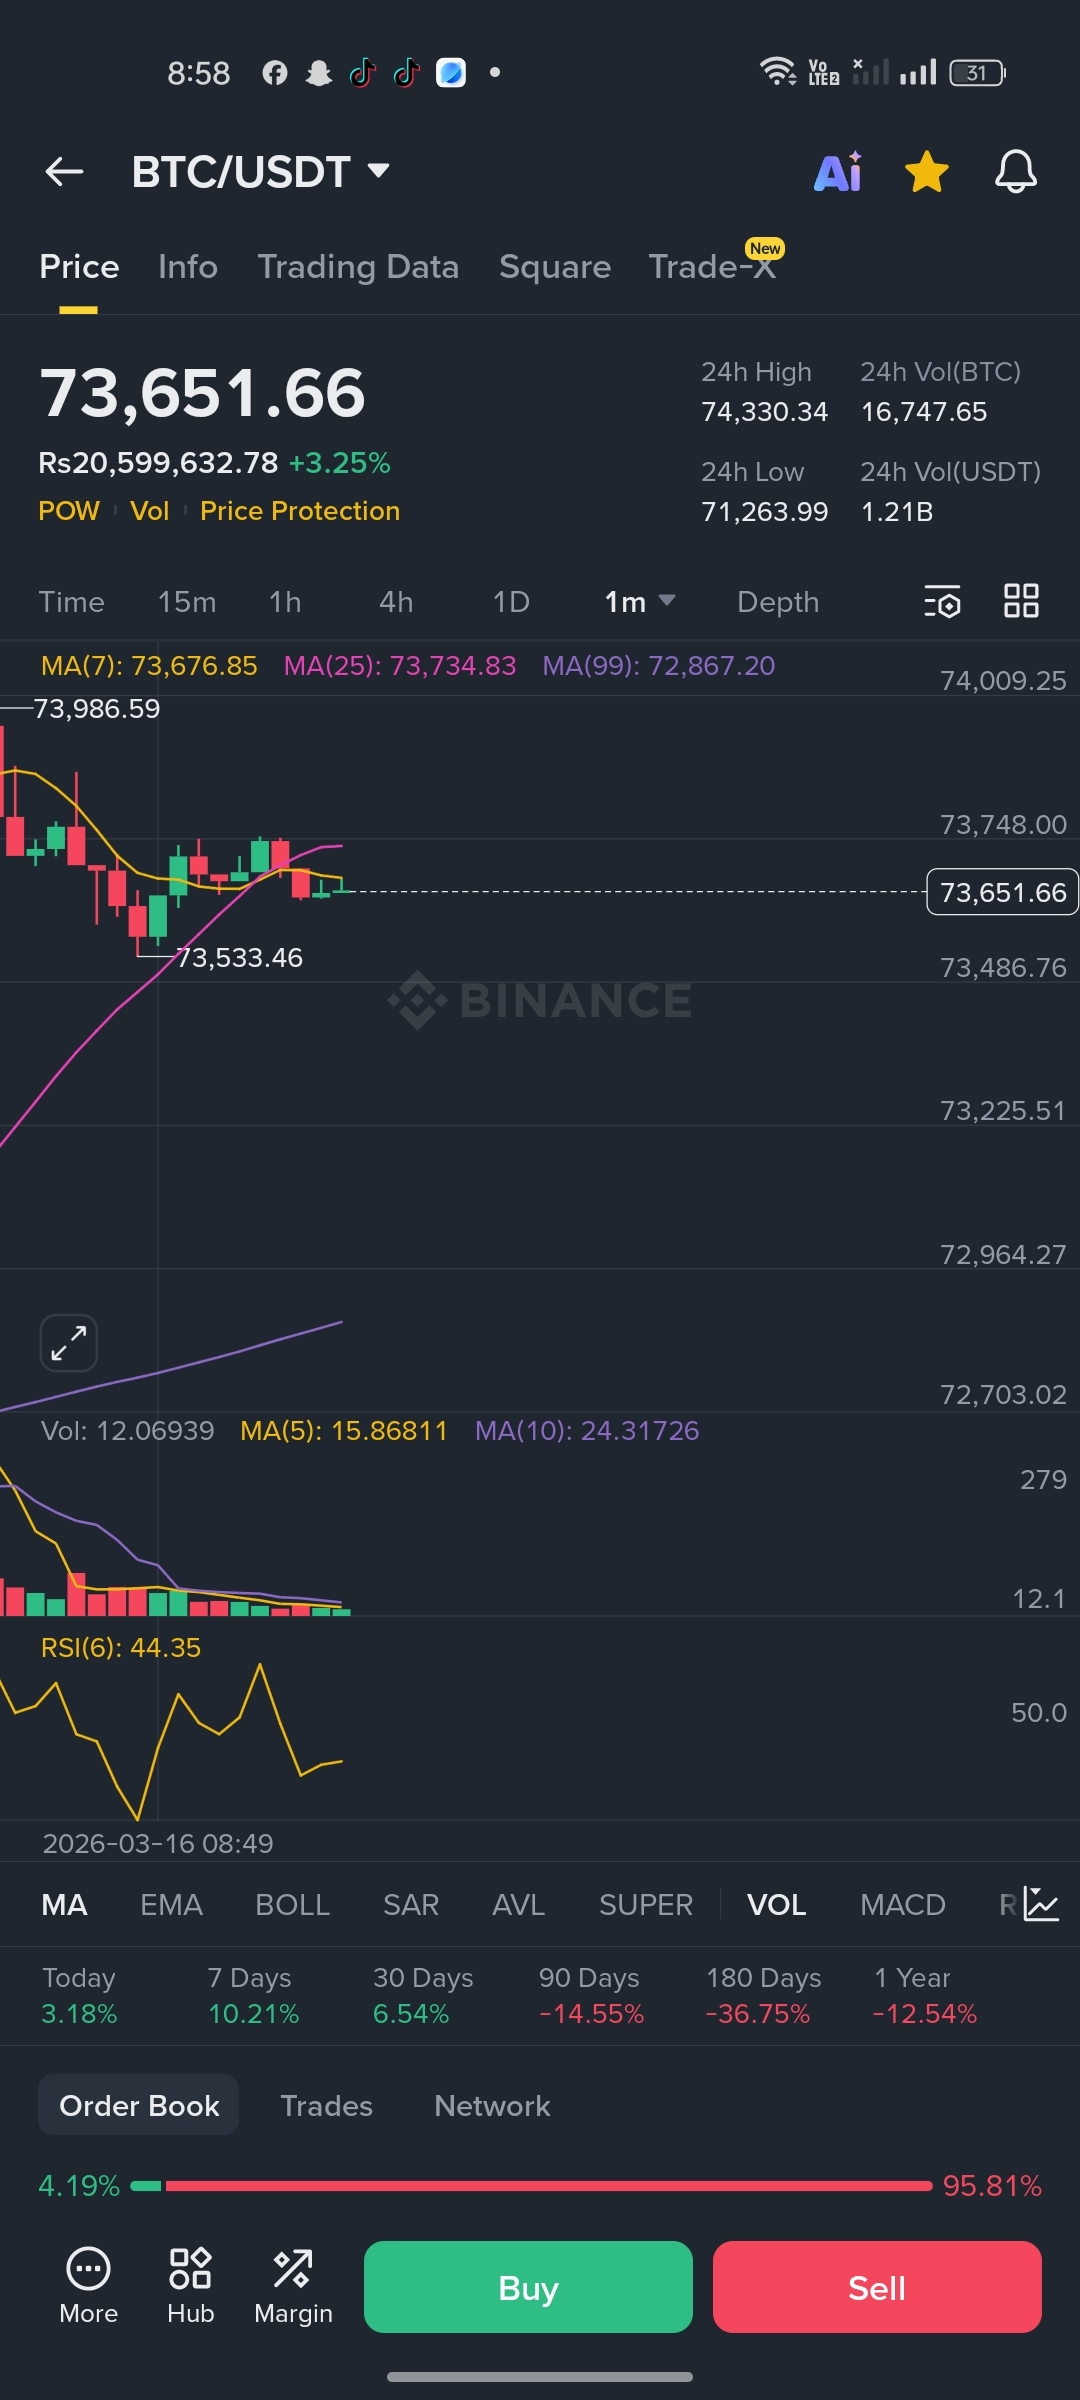
The cryptocurrency market is buzzing with action as Bitcoin ($BTC ) shows strong signs of life. Currently trading at **$73,651.66**, BTC is up **3.25%** in the last 24 hours, flirting with key resistance levels. With a 24-hour high of $74,330.34 and a low of $71,263.99, the volatility is back—and with it, the opportunity.
Here is the technical breakdown of why traders should be watching BTC/USDT closely right now.
1. The Price Action: Holding Strong
Bitcoin is currently trading just below its 7-day Moving Average (MA) of $73,676.85 and the 25-day MA of $73,734.83. While it is slightly under these short-term averages, the fact that it is holding firmly above the crucial 99-day MA of $72,867.20 is a massive bullish signal.
· The Bull Case: As long as BTC stays above $72,800, the trend remains your friend. A clean break above the $73,735 resistance (MA 25) could trigger a rapid squeeze toward the 24h high of $74,330 and beyond.
· The Support Zone: If the market retraces, strong buy orders are likely to appear around $73,225 and the psychological support of $72,964.
2. RSI: Room to Run
The RSI (Relative Strength Index) currently sits at 44.35. In technical analysis, an RSI below 50 often indicates consolidation or a slight bearish bias, but it also signals massive upside potential.
· Why this is good: At 44.35, the asset is not overbought. This means there is plenty of room for buyers to enter before the market becomes "hot" and risks a pullback. A move above 50 would confirm a shift in momentum, likely bringing more volume into the market.
3. Volume Analysis: The Calm Before the Storm?
Current volume (Vol: 12.06k) is below its 5-day (15.86k) and 10-day (24.31k) averages. While low volume might seem bearish to novices, experienced traders know that a low-volume consolidation near resistance often precedes a massive volume spike breakout.
If Bitcoin manages to break above $74,000 with a surge in volume, it will confirm the start of the next leg up.
4. The Bigger Picture: Short-Term Pain, Long-Term Gain?
Looking at the percentage change tabs on the chart tells an interesting story:
· Today: +3.18% (Immediate strength)
· 7 Days: +10.21% (Strong weekly trend)
· 90 Days: -14.55% (Recent correction)
· 180 Days: -36.75% (Deep discount from peak)
The Interpretation: Bitcoin has taken a beating over the last 6 months, but it is recovering rapidly over the last week. This is often the setup for a "V-shaped" recovery. Traders who accumulate here are buying at a significant discount compared to the highs of 180 days ago.
5. The Decision Point
The chart shows a critical battle happening right now:
· The Bears want to push it down to the 95.81% level.
· The Bulls are fighting for the 4.19% move upward.
Conclusion: Why You Should Consider a Trade
The stars are aligning for Bitcoin. It has survived the dip to $71,263, reclaimed the major support trendlines, and is now knocking on the door of resistance. The RSI is primed for a bullish crossover, and volume is waiting to explode.
The Strategy:
· Aggressive Entry: A break and hold above $73,750 could be a great long entry, targeting the 24h high.
· Safe Entry: Wait for a retest of the $73,200 zone to confirm support before entering.
With a 24h volume of 1.21 Billion USDT, the liquidity is there. Don't wait until Bitcoin is trading at $75,000 to wish you had bought at $73,600.
Check the Order Book, set your alerts, and prepare for the move.
#btc #bitcoin #TradingSignals #BTCReclaims70k #CFTCChairCryptoPlan
Trade here👇