

Solana continues to attract attention as price action shifts between recovery and resistance zones. The asset rebounded sharply after holding a key support level, signaling renewed short-term strength.
Traders are now closely monitoring if this rally can maintain its momentum or hit resistance at higher levels. Amid rising volatility, analysts point to both short-term trading opportunities and the larger structural factors influencing Solana’s path.
Short-Term Recovery Faces Key Resistance
Solana has regained bullish momentum after bouncing off key support around $86, signaling increased buying activity at lower prices.
Crypto Hawk notes that the push toward $91.82 reflects strengthening bullish sentiment, though resistance near $96 remains a significant hurdle.
On the 4-hour chart, the price action indicates a temporary shift in momentum, as Solana tries to break its sequence of lower highs. This suggests buyers are reclaiming short-term control, but caution persists as the price nears a known liquidity zone.
$93–$95 Zone Signals Possible Rejection
The Moon Show highlights the $93–$95 zone as a key reaction area, matching prior breakdown points and zones of concentrated supply. Fibonacci retracement levels from 0.618 to 0.786 also reinforce this resistance.
As a result, Solana could push higher to capture liquidity before pulling back—a pattern typical in short-term recoveries within larger consolidation phases. If the price faces rejection here, it may drop back toward support around $88–$90.
A deeper decline to $86 is also possible if bullish momentum fades. Conversely, a strong breakout above $95 would invalidate the bearish outlook, potentially paving the way toward $98 and even $100.
Long-Term Structure Remains Constructive
James notes that $SOL’s weekly structure forms a rounded bottom transitioning into a broader uptrend. While short-term momentum appears weak, the macro outlook remains constructive.
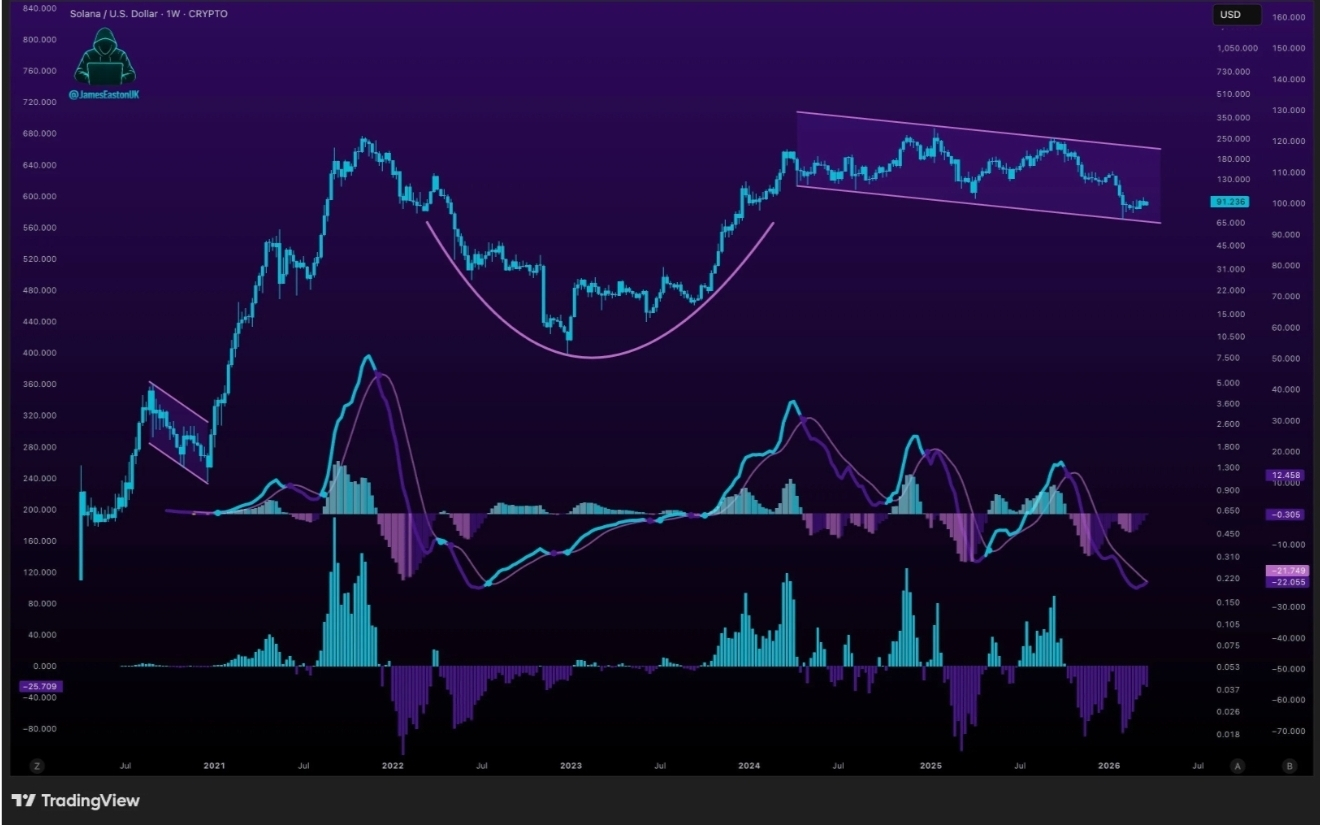
The descending channel that has been in place since early 2024 may soon break, opening the door to higher price targets. If a breakout happens, measured moves indicate potential gains in the $200–$300 range.
Looking further ahead, Solana’s network expansion and liquidity patterns suggest significant upside potential, with projections possibly reaching $1,000. On the downside, a breach of the $85 support level could put $SOL at risk of falling toward $60.
Price Data Reflects Mixed Sentiment
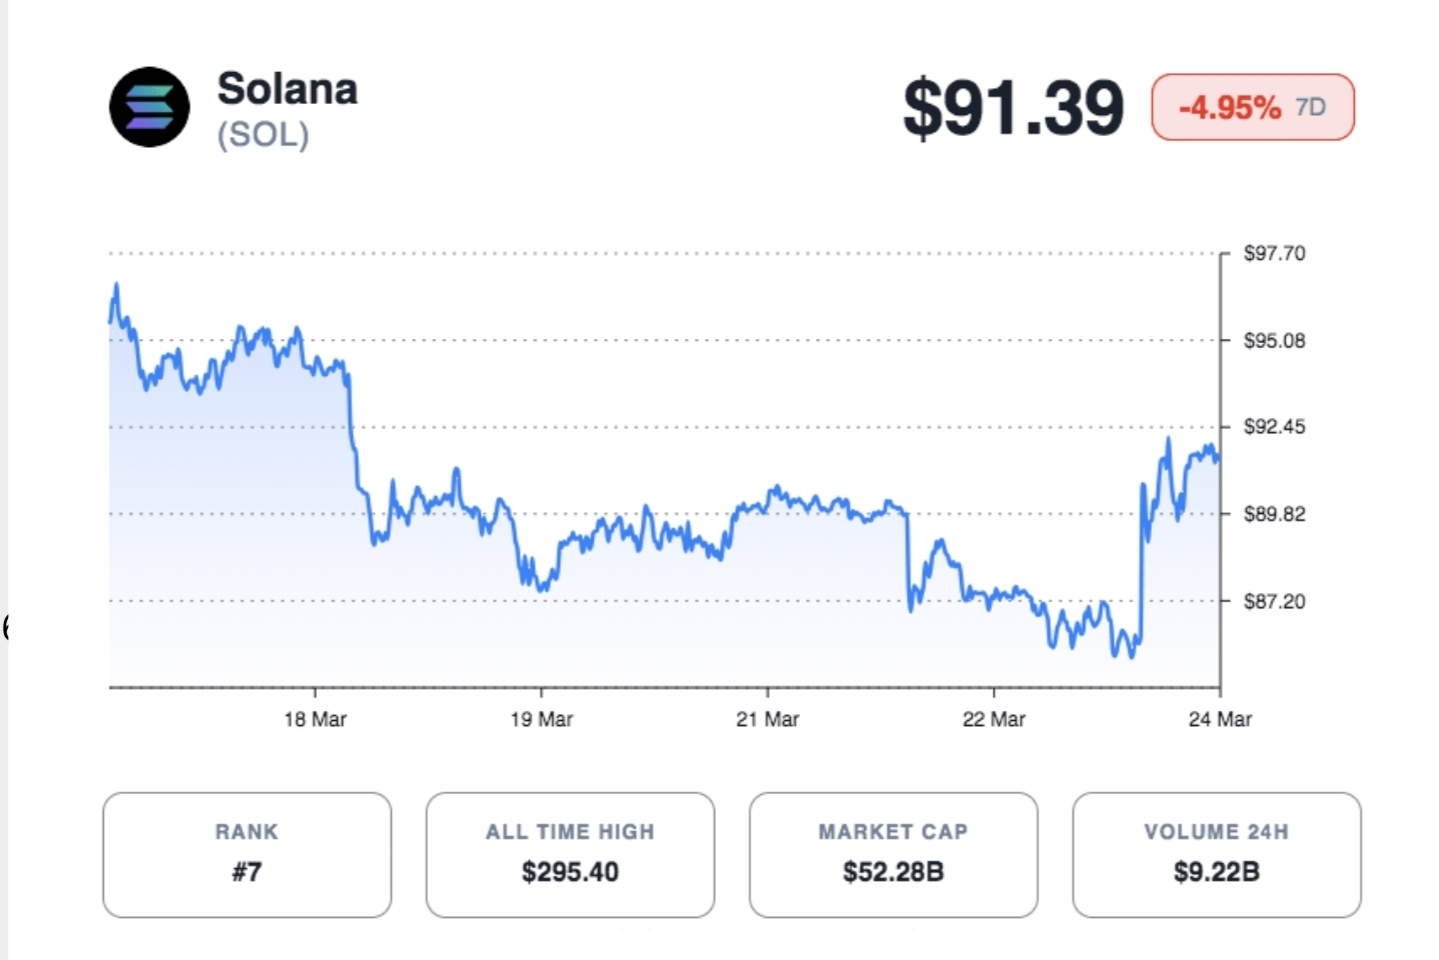
Recent data shows Solana trading around $91.32, posting strong daily gains of 6.32% over the last 24 hours. Despite this, it remains down 4.62% for the week, reflecting a mix of bullish and bearish sentiment.