Das 30-Minuten-Gold-Chart zeigt eine potenzielle bullische Fortsetzungsstruktur nach einem korrigierenden Rückgang. Der Preis hat eine kurzfristige Basis nahe der Unterstützung bei 4300 gebildet und zeigt Anzeichen von Akkumulation mit höheren Tiefs. Der MA50 fungiert als dynamische Unterstützung, während der Preis versucht, über den MA20 + Bollinger-Mittelband zu steigen, was auf eine zunehmende Dynamik hindeutet.
Der RSI stabilisiert sich um die 50-Zone, was auf eine neutrale bis bullische Dynamik hindeutet, mit Raum für eine Aufwärtsausdehnung. Wenn die Käufer den Druck über 4400–4410 aufrechterhalten, erscheinen die nächsten Liquiditätsziele klar definiert.
---
📊 Technischer Ausblick
Trendneigung: Kurzfristige bullische Erholung
Momentum: RSI hält über der Mittellinie (50)
Wichtige Widerstandsbereiche: 4510 → 4605
Wichtige Unterstützungsbereiche: 4300 → 4225 → 4100
Struktur: Höhere Tiefbildung deutet auf eine mögliche Fortsetzungsrallye hin
---
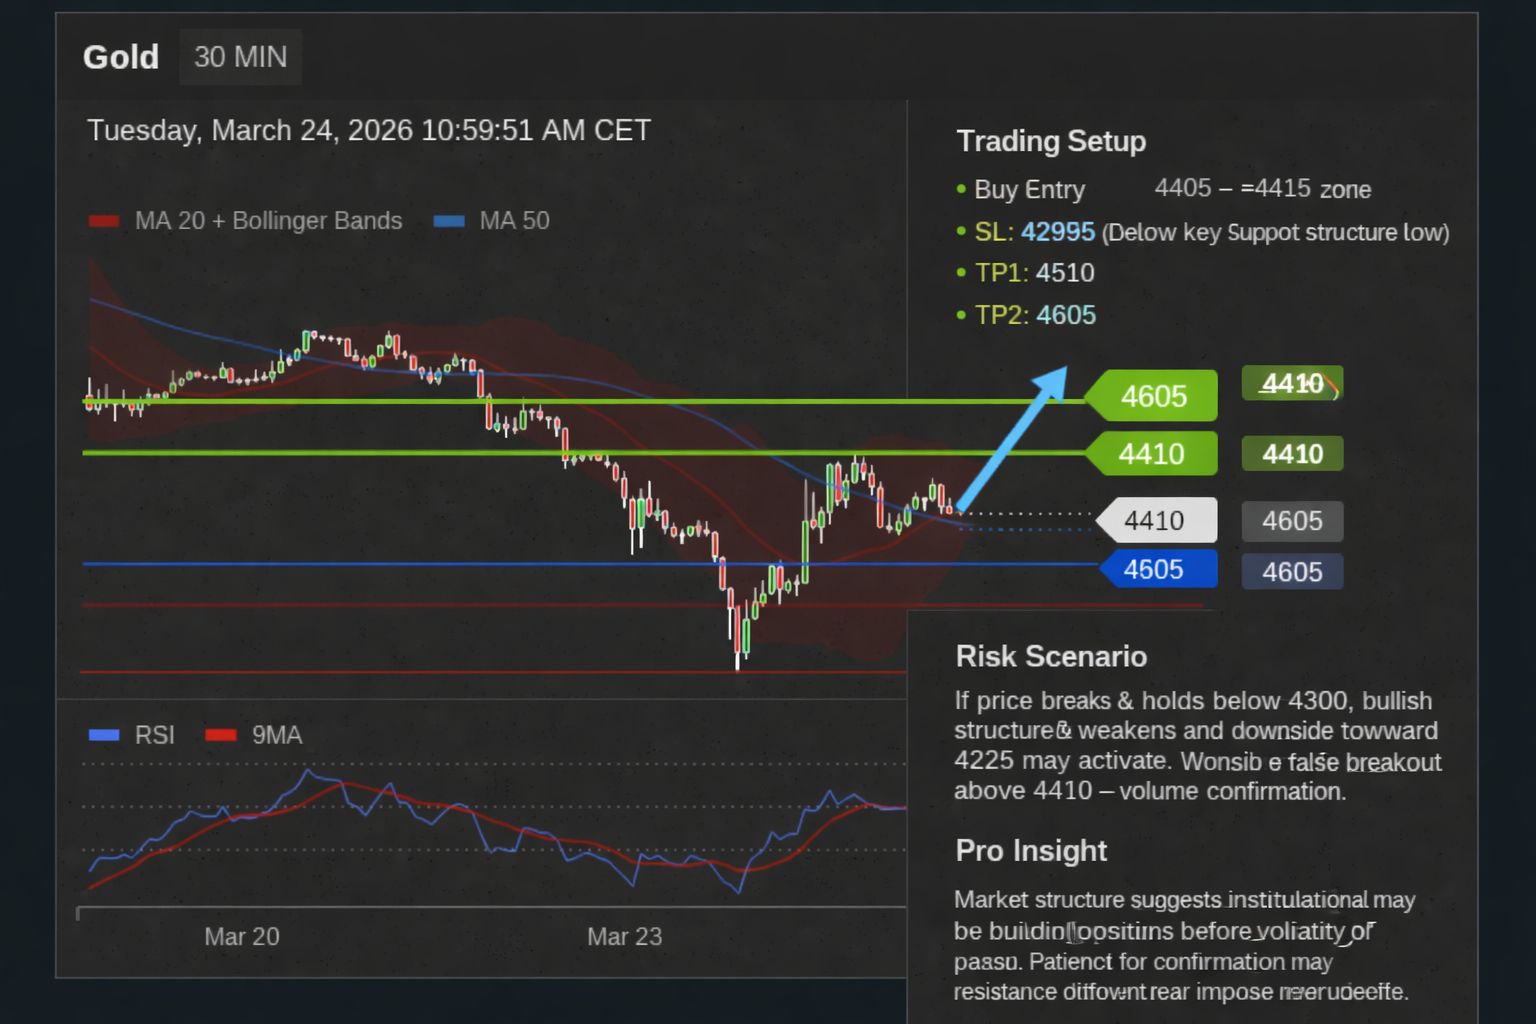
🎯 Handelssetup
Buy Entry: 4405 – 4415 Zone
Stop Loss (SL): 4295 (unterhalb der wichtigen Unterstützung & Struktur tief)
Take Profit (TP1): 4510
Take Profit (TP2): 4605
---
⚠️ Risikoszenario
Wenn der Preis unter 4300 bricht und hält, schwächt sich die bullische Struktur und ein Rückgang in Richtung 4225 könnte aktiviert werden. Achten Sie auf einen falschen Ausbruch über 4410 - Volumenbestätigung ist entscheidend.
---
🧠 Pro Insight
Die Marktstruktur deutet darauf hin, dass Institutionen möglicherweise Positionen aufbauen, bevor es zu einer Volatilitätserweiterung kommt. Geduld auf Bestätigung nahe dem Widerstandsbruch kann das Risiko-Ertrags-Profil verbessern.
#GOLD #XAUUSD #forextrading #TechnicalAnalysis #smartmoney
JETZT HANDELN