Die Grundlagen der Kerzen
Möchten Sie Chartmuster mit Zuversicht erkennen? Es beginnt alles mit dem Verständnis von Kerzen. Sie helfen Ihnen, die Marktsentiment auf einen Blick zu erfassen, indem sie zeigen, wie sich der Preis über einen bestimmten Zeitraum bewegt hat.
Hier ist eine schnelle und klare Auffrischung der Grundlagen.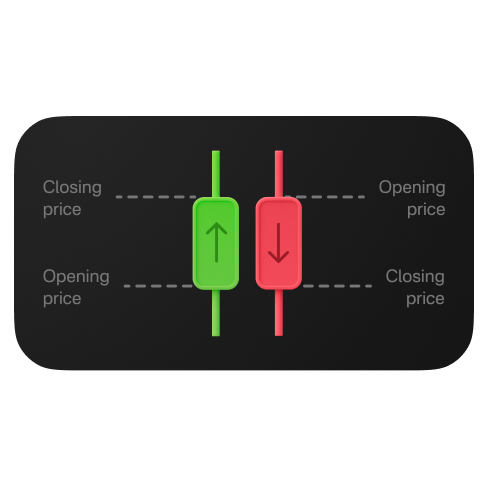
Was eine Kerze zeigt
Jede Kerze stellt vier wichtige Preisniveaus dar: Eröffnungspreis, Schlusskurs, Höchstpreis und Tiefstpreis. Gemeinsam zeigen sie, wer die Kontrolle hatte — Käufer oder Verkäufer.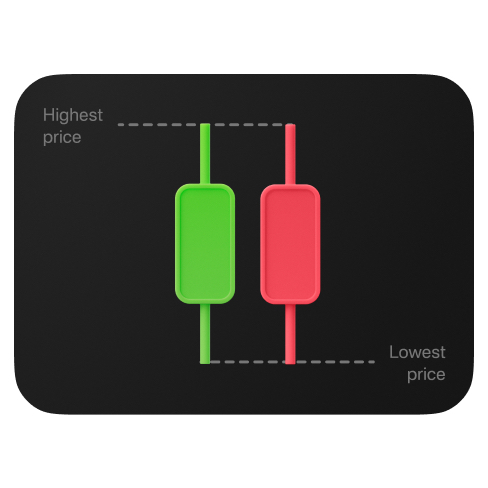
Bedeutung der Kerzenfarben
🟩 Grün = bullischer Trend. Der Preis schloss höher als er eröffnet wurde. Käufer waren stärker. 🟥 Rot = bärischer Trend. Der Preis schloss niedriger als er eröffnet wurde. Verkäufer übernahmen die Kontrolle.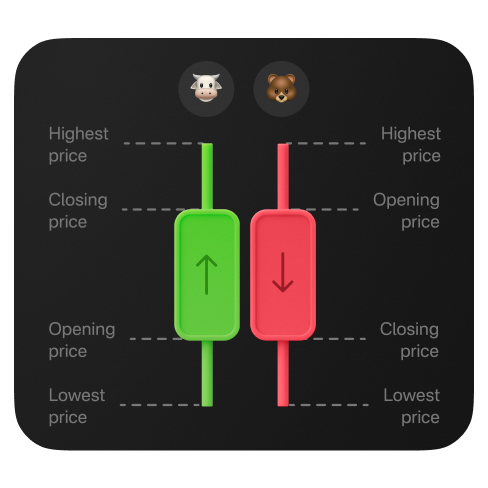
Dochte und Preisreaktionen
Dochte sind die dünnen Linien über und unter dem Kerzenkörper. Sie zeigen Preisextreme und wie der Markt darauf reagiert hat. Dochte helfen Ihnen, Zögern, Ablehnung und potenzielle Umkehrungen zu erkennen.
Jetzt sind Sie dran 🚀
Üben Sie, Farben und Dochte zu erkennen, während Sie in Ihrem eigenen Tempo handeln. Als Nächstes werden wir tiefer in das Lesen von Kerzen in realen Marktsituationen eintauchen.
Jetzt Handel eröffnen!
Gefällt mir, Teilen und Folgen für weitere Tipps wie diesen. 💯✅