$SIGN 🚨 The market structure for SIGN/USDT is currently at a critical junction. While the long-term trend remains under bearish pressure, several technical indicators suggest that a momentum shift could be brewing at these lower levels.
🔑 Key Support Zone
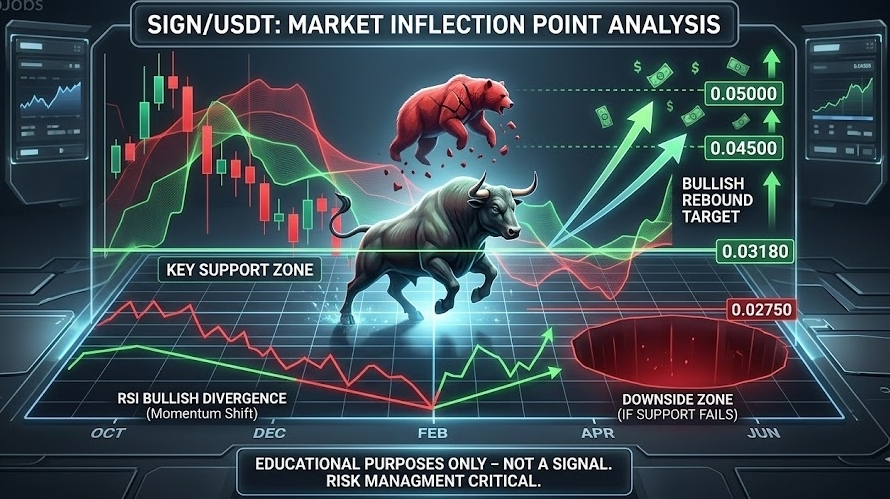
The price is currently testing a significant Daily Support Floor between $0.0310 and $0.0299. This area has historically acted as a "buy zone" where demand tends to outweigh supply.
• The Pivot Point: Keep a close eye on the $0.0318 level. A daily candle close above this mark would confirm that buyers are defending the support, potentially triggering a "relief rally" or a FOMO-driven bounce toward the $0.0450 resistance.
📊 Momentum & RSI Divergence
Even though the price action looks weak, the Relative Strength Index (RSI) is telling a different story:
• Bullish Divergence: While the price has been making lower lows, the RSI is starting to trend upward. This "hidden strength" often signals that selling exhaustion is kicking in.
• Ichimoku Context: The price remains below the Cloud, meaning the overall trend is still "Red." However, the narrowing distance suggests the bearish grip is loosening.
⚠️ Risk Scenarios
• The Bull Case: A successful hold here targets the $0.0400 – $0.0500 range.
• The Bear Case: If the $0.0318 level fails to hold on a daily closing basis, expect a further slide toward the next major liquidity zone at $0.0275 – $0.0270.
👉 This is a "wait and see" moment. Watch for a confirmed bounce at support before looking for entry opportunities.