Right now, BTC/USDT on the 1H timeframe is sitting around 66,373, and the chart is telling a pretty clear story:
a sharp sell-off → followed by a weak recovery → now entering a critical zone.
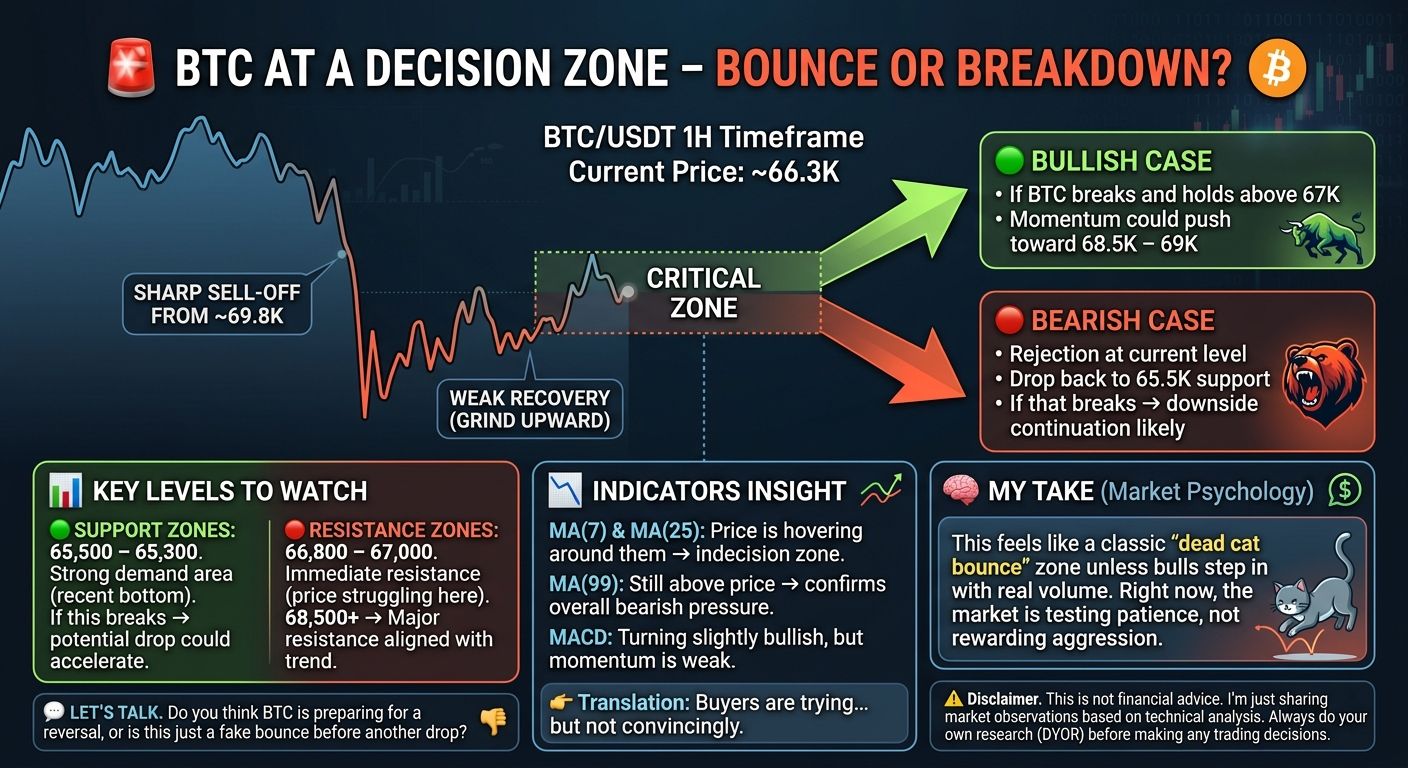
📊 What the Chart Is Showing
After dropping hard from the ~69.8K region, BTC found a temporary bottom at 65,548. Since then, we’ve seen a slow grind upward — but nothing explosive.
Current Price: ~66.3K
24H High: 67.9K
24H Low: 65.5K
👉 This looks more like a relief bounce than a strong trend reversal.
🔑 Key Levels to Watch
🟢 Support Zones:
65,500 – 65,300 → Strong demand area (recent bottom)
If this breaks → next potential drop could accelerate
🔴 Resistance Zones:
66,800 – 67,000 → Immediate resistance (price struggling here)
68,500+ → Major resistance aligned with trend
📉 Indicators Insight
MA(7) & MA(25): Price is hovering around them → indecision zone
MA(99): Still above price → confirms overall bearish pressure
MACD: Turning slightly bullish, but momentum is weak
👉 Translation: Buyers are trying… but not convincingly.
⚔️ Possible Scenarios
🟢 Bullish Case:
If BTC breaks and holds above 67K
Momentum could push toward 68.5K – 69K
🔴 Bearish Case:
Rejection at current level
Drop back to 65.5K support
If that breaks → downside continuation likely
🧠 My Take (Market Psychology)
This feels like a classic "dead cat bounce" zone unless bulls step in with real volume.
Right now, the market is testing patience, not rewarding aggression.
💬 Let’s Talk
Do you think BTC is preparing for a reversal, or is this just a fake bounce before another drop? 👇
⚠️ Disclaimer
This is not financial advice. I’m just sharing market observations based on technical analysis. Always do your own research (DYOR) before making any trading decisions.
#BTC #CryptoAnalysis #cryptotrading #Binance #priceaction