Highlights
Ethereum price faces pressure below key $2,000 resistance.
Institutional outflows and macro tensions limit short-term upside momentum.
Broader crypto recovery could drive ETH toward $4,000.

Ethereum Price remains under pressure as investors assess the possibility of a move toward $4,000 by the end of 2026. The Ether recently slipped below $2,100 amid rising geopolitical tensions.
Broader crypto market weakness has limited recovery attempts. Nonetheless, a number of long-term drivers remain in favor of a possible rebound should market conditions improve.
Crypto Market Recovery Could Support a $4,000 Target
Ethereum reached its all-time high of $4,953 on August 24, 2025. ETH currently stands at nearly 60% of that peak at current levels of about $2,000.
That scale of recovery would likely depend on a broader market rally. A Bitcoin move back above $100,000 could restore confidence across major altcoins. SOL, DOGE, ADA, BNB, and XRP are some of the assets that tend to increase when the market is in a good cycle.
The supply structure of Ethereum can also impact the price action in the future. The fee-burn model of the network burns part of the transaction fees out of circulation. Increase in network activity can hence, decrease supply.
Staking involvement still traps up large amounts of ETH. The increased adoption of Layer-2 can enhance scalability and allow it to maintain its increased usage. Real-life integration of assets and tokenization programs are other catalysts to be experienced in the long run.
Institutional Activity and Capital Flows
Institutional flows remain a central factor in Ethereum’s outlook. BitMine recently announced its investment in Beast Industries, amounting to $200 million.
🚨LATEST: TOM LEE’S BITMINE BUYS ANOTHER $108M IN ETH
Tom Lee’s (@fundstrat) Bitmine (@BitMNR) has likely acquired 50,000 $ETH worth $108.3 million from FalconX, according to @lookonchain.
Blockchain data shows the transaction took place roughly 7-8 hours back.
FalconX acted
On chain records showed that approximately 50,000 ETH, worth about 108.3 million US dollars passed through FalconX. Being able to sustain such activity can intensify sentiment. Nonetheless, the current ETF statistics indicate divergent institutional commitment.
ETF Outflows and Macro Pressure
Ethereum has declined about 7% over the past week, extending weekly losses to around 6%. Escalating Middle East tensions have weighed on global financial markets. The total cryptocurrency market capitalization slipped 1.63% to approximately $2.29 trillion. On March 27, U.S. Bitcoin spot ETFs recorded $225 million in net outflows.
According to SoSoValue data, on March 27 (ET), U.S. Bitcoin spot ETFs recorded a total net outflow of $225 million. Meanwhile, Ethereum spot ETFs saw a total net outflow of $48.54 million, marking an eight-day streak
Ether spot ETFs recorded an outflow of 48.54 million, and this is the eight consecutive outflows. The Fear and Greed Index has been at 23, indicating long-term cautiousness. Technical analysis indicates that it is weak below major moving averages. A longer way to $4,000 can be achieved only with more inflows and better macro stability.
Will Ethereum Price Hold $2,000 Support Level?
The latest ETH price traded at $2,045 during the latest four-hour session. The cryptocurrency slipped modestly, posting a 0.37% decline for the period.
The technical charts indicate that ETH is floating just below the most crucial level of $2,000 which is the psychological level. This area now serves as short-term resistance to traders. The long-term trend that breaches the level of $2,000 would pave the way to $2,200.
Stronger upside momentum may target the $2,300 region next as per long-term ETH projection. That level previously served as a consolidation zone earlier this month. A breakout there could expose the $2,500 resistance barrier.
The Relative Strength Index now stands at about 34 in the four hour time frame. This reading is an indication that ETH is heading towards the over sold region.
At the same time, the MACD indicator is in the negative region. The histogram demonstrates weakening bearish dynamics, but buyers retain control over a short period of time.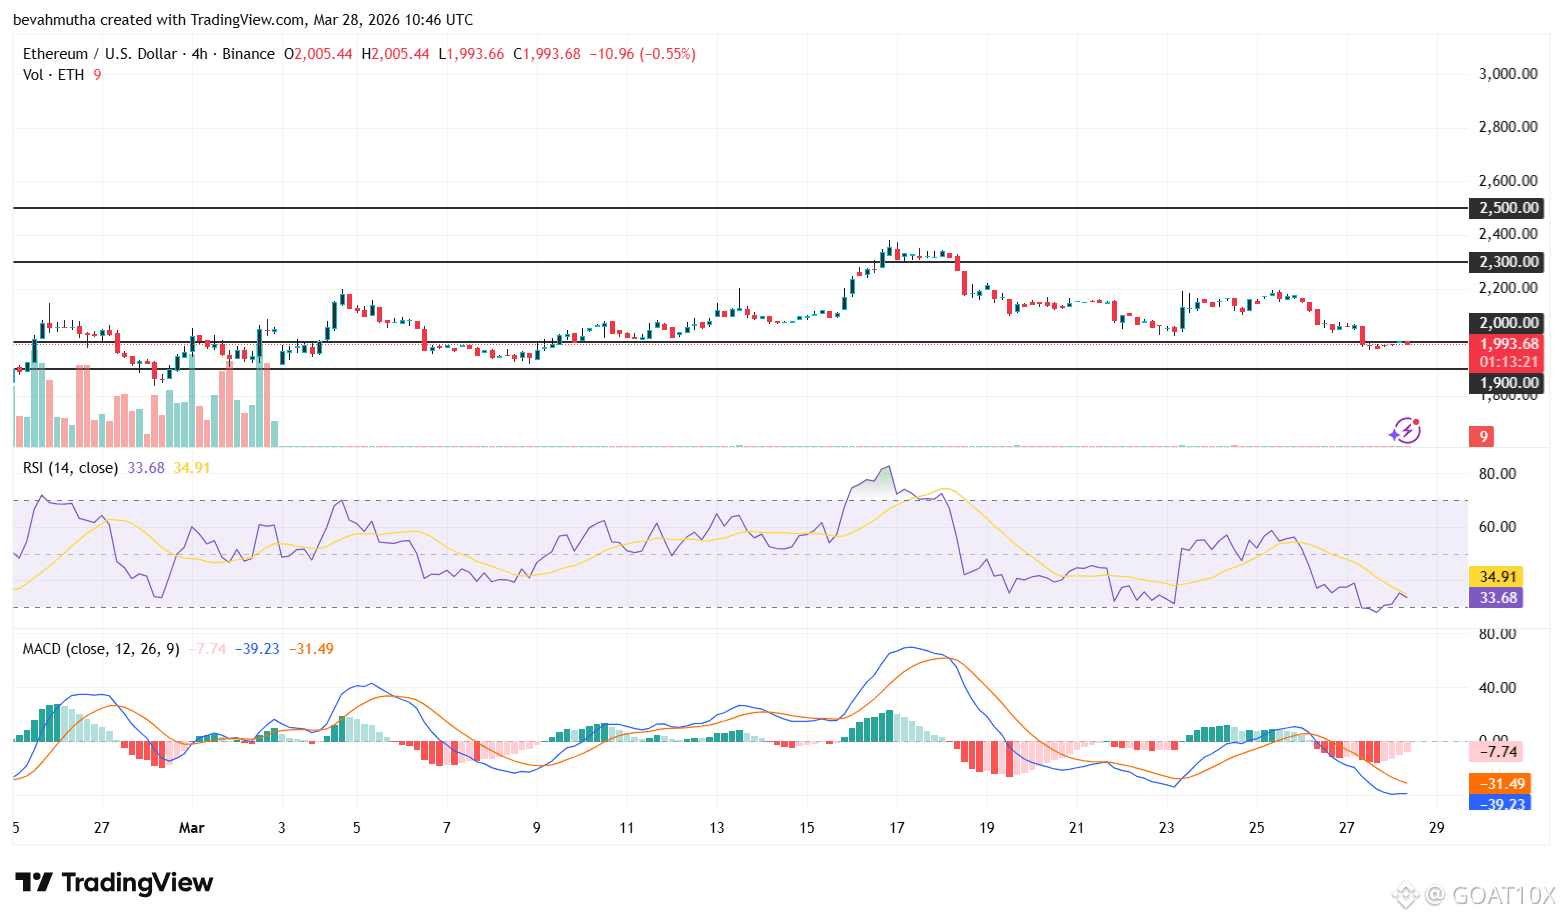
On the negative side, support is developing around $1,950. A break out of this floor can lead to the selling pressure of about $1,900. Prolonged weakness might even re-test the range of $1,850.$ETH
