Digital asset investment products recorded $414 million in outflows in the week ending March 27, the first net outflow in five weeks, as two macro developments converged simultaneously.
Key Takeaways
First ETP outflows in five weeks totalling $414M.
FOMC rate expectations flipped from cuts to hikes.
US drove $445M in outflows while Germany and Canada bought.
Ethereum hardest hit at $222M outflows, worst YTD of any asset.
STH loss pressure on Binance spiked to 9,300 BTC on March 27.
Iran conflict fears intensified, and June FOMC interest rate expectations flipped from rate cuts to rate hikes. Total assets under management declined to $129 billion, revisiting levels last seen in early February and broadly comparable to April 2025 during the initial phase of Trump's tariffs.
The scale of the outflow is significant. What the data shows about who sold and who bought is more specific.
What Drove the Outflows
According to CoinShares' weekly flows report, the trigger was a combination of two macro pressures arriving at the same time. The drawn-out nature of the Iran conflict has been worsening inflation fears across financial markets, a dynamic that feeds directly into Federal Reserve rate expectations. By the week ending March 27, June FOMC expectations had shifted from pricing rate cuts to pricing rate hikes. That shift removes one of the primary macro tailwinds that had been supporting risk asset inflows through February and early March.
The result was $414 million leaving digital asset investment products in a single week, pushing total AuM back to levels not seen since early February. The previous comparable AuM level was April 2025, during the initial market response to Trump's tariff announcements.
The outflows were not distributed evenly across geographies. The divergence in where the selling came from is the more revealing data point.
Who Sold and Who Bought
The United States was responsible for $445.2 million in outflows, exceeding the total weekly figure because other markets were net positive. Germany added $21.2 million in inflows, treating the price weakness as a buying opportunity. Canada added $15.9 million. Brazil contributed $2.6 million. The negative sentiment was almost entirely a US phenomenon, with minor additional outflows from Switzerland at $4 million.
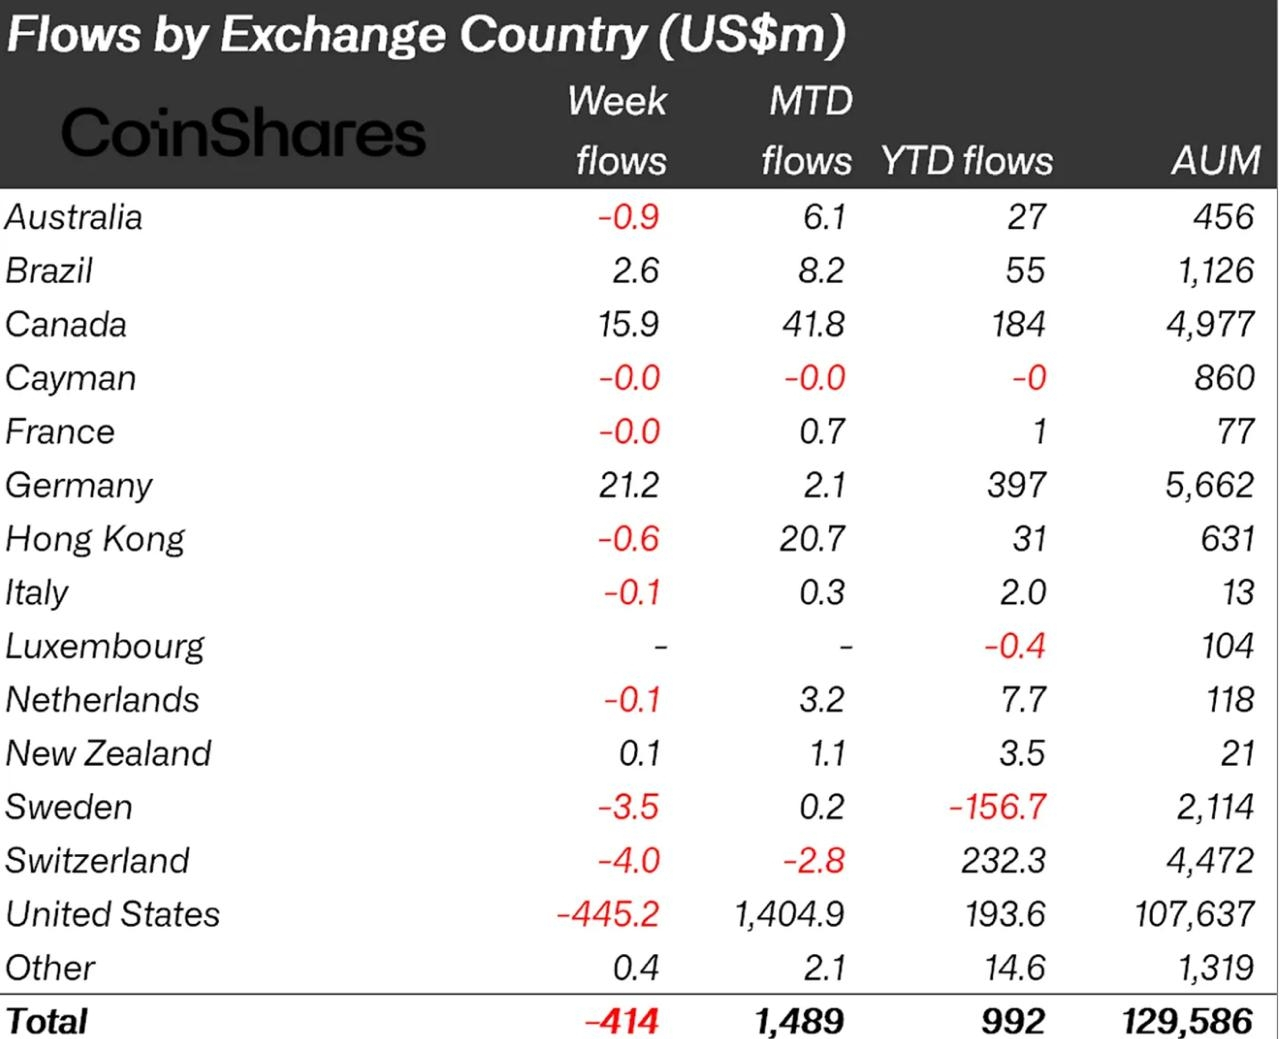
That geographic split carries a specific implication. The macro sensitivity driving US outflows, Iran conflict fears, FOMC rate hike repricing, inflation concerns, is concentrated in the market most exposed to Federal Reserve policy expectations. European and Canadian investors, operating under different rate environments, responded to the same price weakness by adding exposure.
The same divergence appears at the asset level.
How Assets Were Affected
Ethereum absorbed the heaviest damage. Weekly outflows of $221.8 million pushed its year-to-date net flow position to negative $273 million, the worst of any digital asset tracked. CoinShares attributed this likely to ongoing Clarity Act concerns, with uncertainty around stablecoin yield regulation weighing specifically on Ethereum's institutional demand picture.
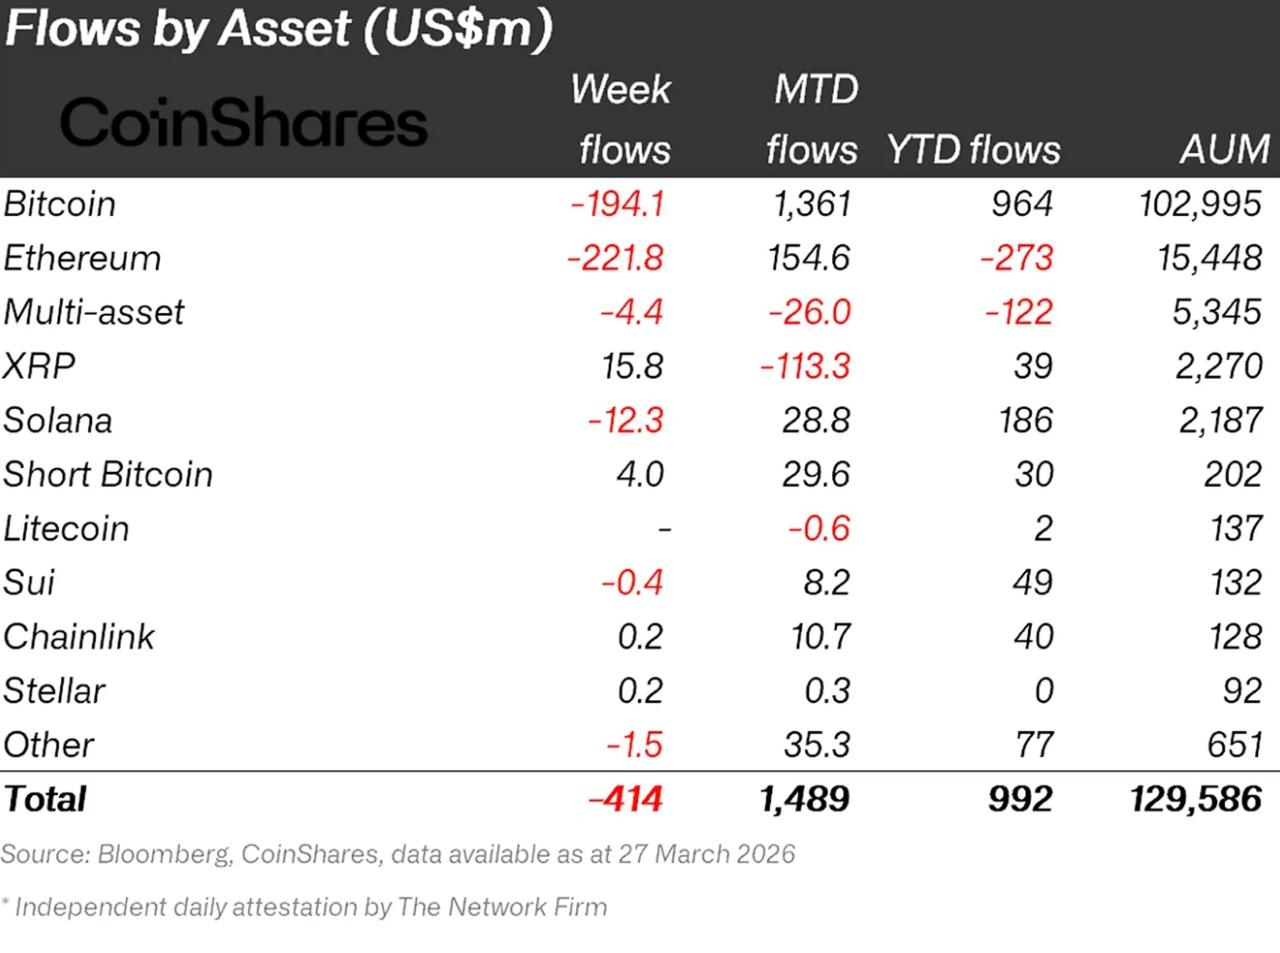
Bitcoin saw $194.1 million in weekly outflows but held its year-to-date position at $964 million net positive, the resilience of a $102.9 billion AuM base absorbing a single difficult week without losing its annual trend. Short Bitcoin investment products attracted $4 million in inflows, reflecting a subset of investors positioning for further downside rather than recovery.
XRP was the standout in the opposite direction. Weekly inflows of $15.8 million made it one of the few assets to attract net positive flows during the week - consistent with its institutional development pipeline continuing to draw capital even against a broadly negative backdrop. Solana recorded $12.3 million in outflows.
The flow data describes institutional positioning. The on-chain data describes what was happening at the retail and short-term holder level simultaneously.
What the On-Chain Data Shows
On March 27, the STH Loss to Binance metric tracked by CryptoQuant report climbed above 9,300 BTC, one of the strongest recent loss-driven transfer readings visible on the chart. Short-term holders were sending coins to Binance while sitting at a loss, the pattern that typically appears when weaker hands are forced to react to downside conditions rather than hold through them.
What makes the reading analytically important is what did not accompany it. The chart's 7-day standard deviation, a measure of broader market behavioural dispersion, stood near 277 during the late-February stress episode. By March 26, it had fallen to approximately 253, even as the loss pressure intensified again into March 27. The broader panic backdrop did not expand at the same pace as the individual loss metric.
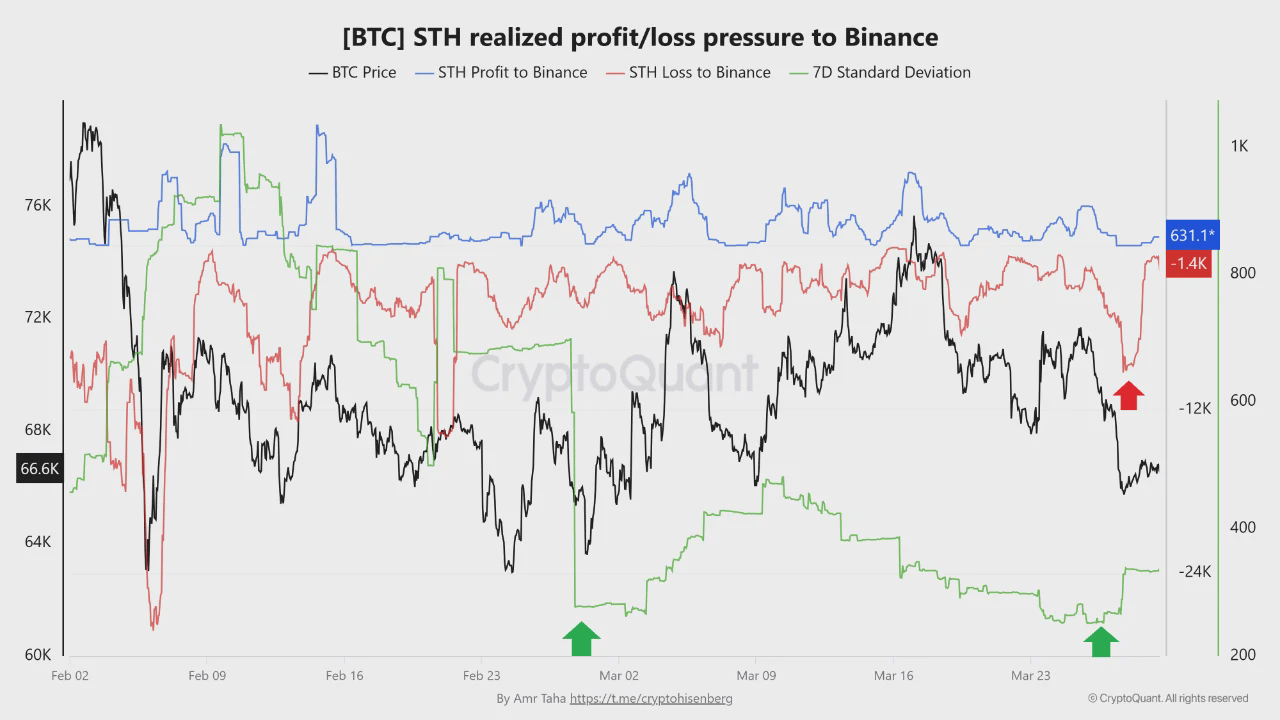
That distinction separates the current episode from a systemic capitulation event. Loss realisation among short-term holders has picked up sharply. The wider market stress that would confirm a full-scale panic phase - measured by volatility expansion and behavioural dispersion, has not matched it. Some short-term participants are capitulating into weakness. The sell-side event still looks more localised than a market-wide stress episode.
The signal to watch is a continued rise in Binance loss pressure accompanied by a renewed expansion in the 7D deviation metric. That combination would indicate the current episode is escalating toward a deeper capitulation phase rather than resolving into the kind of contained stress the data currently describes.
What the Data Leaves Open
The week ending March 27 was not a panic. It was a repricing. US investors responded to two macro developments — an Iran conflict with no visible endpoint and a Federal Reserve that may be moving toward hikes rather than cuts — by pulling $445 million from digital asset products. European and Canadian investors looked at the same prices and bought.
That divergence is the most telling part of the dataset. When the same asset at the same price produces opposite behaviour across geographies, the question is not whether crypto is broken, it is which macro interpretation proves correct. If the FOMC repricing holds and inflation fears persist, the US selling was rational. If the Iran situation de-escalates and rate expectations shift back, the European and Canadian buying will have been the smarter read.
The short-term holder capitulation on Binance and the $414 million in ETP outflows are both there. Neither has yet crossed the threshold that historically confirms a systemic break. The data describes a market under pressure choosing sides. The next macro development decides which side was right.