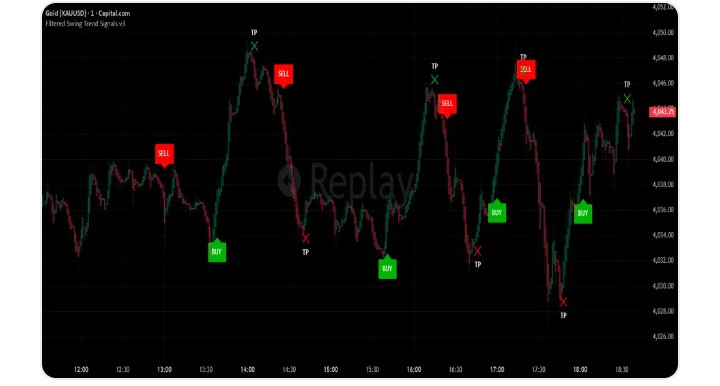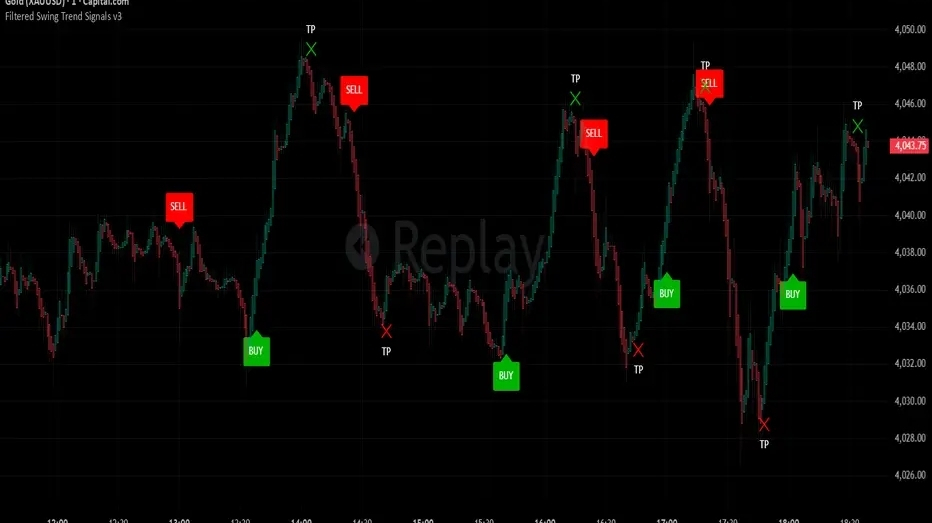
Gefilterte Swing-Trend-Signale v3
Quellcode: //@version=5
indikator("Gefilterte Swing-Trend-Signale v3", overlay=true, max_labels_count=500)
// --- Eingaben ---
// Kern-Trendparameter
atrPeriode = input.int(10, title="Trend ATR Länge", group="1. Trendmotor")
faktor = input.float(3.0, title="Trend Multiplikator", step=0.1, group="1. Trendmotor")
// Momentum & Kraftfilter
adxLänge = input.int(14, title="ADX Länge", group="2. Momentum Kraft")
adxSchwelle = input.int(20, title="ADX Schwelle", group="2. Momentum Kraft")
macdFast = input.int(12, title="MACD Schnell", group="2. Momentum Kraft")
macdSlow = input.int(26, title="MACD Langsam", group="2. Momentum Kraft")
macdSignal = input.int(9, title="MACD Signal", group="2. Momentum Kraft")
// Dynamische Ausstiegsparameter
exitEmaLength = input.int(13, title="Ausstiegs-EMA Länge (nachlassendes Momentum)", group="3. Ausstiegsstrategie")
minBarsHold = input.int(5, title="Minimale Balken, um vor TP zu halten", group="3. Ausstiegsstrategie")
// --- Berechnungen ---
// 1. Kerntrend
[supertrend, direction] = ta.supertrend(factor, atrPeriod)
isUptrend = direction < 0
isDowntrend = direction > 0
// 2. Momentum Kraftfilter
[diplus, diminus, adx] = ta.dmi(adxLength, adxLength)
[macdLine, sigLine, histLine] = ta.macd(close, macdFast, macdSlow, macdSignal)
bullishFuel = (adx > adxThreshold) und (histLine > 0)
bearishFuel = (adx > adxThreshold) und (histLine < 0)
// 3. Schnelle Momentum EMA (Für Ausstiege UND Wieder-Einstiege verwendet)
exitEma = ta.ema(close, exitEmaLength)
// --- Zustandsvariablen ---
var bool inLong = false
var bool inShort = false
var int entryBar = na
var float entryPrice = na
// --- Einstieg Logik (Aktualisiert für Wieder-Einstiege) ---
// Trigger 1: Der ursprüngliche Supertrend-Umschwung
longStart = ta.change(direction) < 0
kurzStart = ta.change(direction) > 0
// Trigger 2: Fortsetzung / Wieder-Einstieg (Trend bleibt intakt, Preis steigt nach einem Rückgang über die schnelle EMA zurück)
longFortsetzung = isUptrend und ta.crossover(close, exitEma)
kurzFortsetzung = isDowntrend und ta.crossunder(close, exitEma)
// Trigger kombinieren mit Kraft
longCond = (longStart oder longFortsetzung) und bullishFuel
shortCond = (kurzStart oder kurzFortsetzung) und bearishFuel
// Sicherstellen, dass wir nur auslösen, wenn wir uns nicht bereits aktiv in einem Trade befinden
longSignal = longCond und nicht inLong
kurzSignal = shortCond und nicht inShort
wenn longSignal
inLong := true
inShort := false
entryBar := bar_index
entryPrice := close
wenn kurzSignal
inShort := true
inLong := false
entryBar := bar_index
entryPrice := close
// --- Ausstieg / Gewinnmitnahme Logik ---
barsHeld = bar_index - entryBar
// Nachlassendes Momentum wird erkannt, wenn der Preis wieder über die kurzfristige EMA kreuzt
longWaning = ta.crossunder(close, exitEma)
kurzWaning = ta.crossover(close, exitEma)
// TP-Kriterien: Für X Balken gehalten, Derzeit im Gewinn und Momentum lässt nach
longTP = inLong und (barsHeld >= minBarsHold) und (close > entryPrice) und longWaning
kurzTP = inShort und (barsHeld >= minBarsHold) und (close < entryPrice) und kurzWaning
// Stop-Loss / Hard Reset Kriterien (Wenn der Trend vollständig umschlägt, ohne die TP-Regeln zu treffen)
longSL = inLong und ta.change(direction) > 0
kurzSL = inShort und ta.change(direction) < 0
// Zustände zurücksetzen beim Ausstieg, damit das Skript nach einem Wieder-Einstieg suchen kann
wenn longTP oder longSL
inLong := false
wenn kurzTP oder kurzSL
inShort := false
// --- Visuals ---
// Signale zeichnen
plotshape(longSignal, title="Kaufsignal", text="BUY", style=shape.labelup, location=location.belowbar, color=color.new(#00b300, 0), textcolor=color.white, size=size.normal)
plotshape(kurzSignal, title="Verkaufssignal", text="SELL", style=shape.labeldown, location=location.abovebar, color=color.new(#ff0000, 0), textcolor=color.white, size=size.normal)
// Gewinnmitnahmen zeichnen
plotshape(longTP, title="TP Long", text="TP", style=shape.xcross, location=location.abovebar, color=color.new(#00b300, 0), textcolor=color.white, size=size.small)
plotshape(kurzTP, title="TP Short", text="TP", style=shape.xcross, location=location.belowbar, color=color.new(#ff0000, 0), textcolor=color.white, size=size.small)