Quellcode : // ============================================================
// NQ NY Session — 8 EMA / 13·21·55 TEMA Dashboard
// Version: v3.0
//
// Funktionen:
// — 8 EMA (blau, dick) + 13/21/55 TEMA Linien
// — VWAP
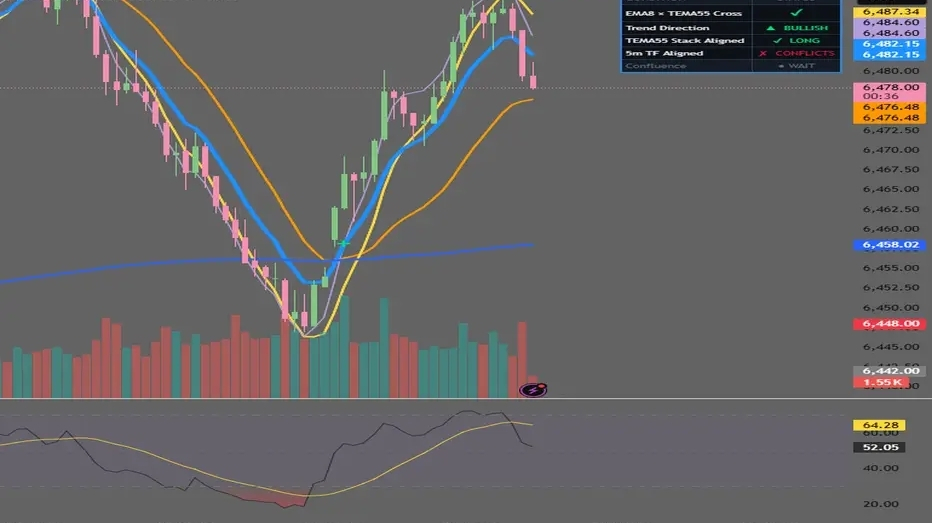
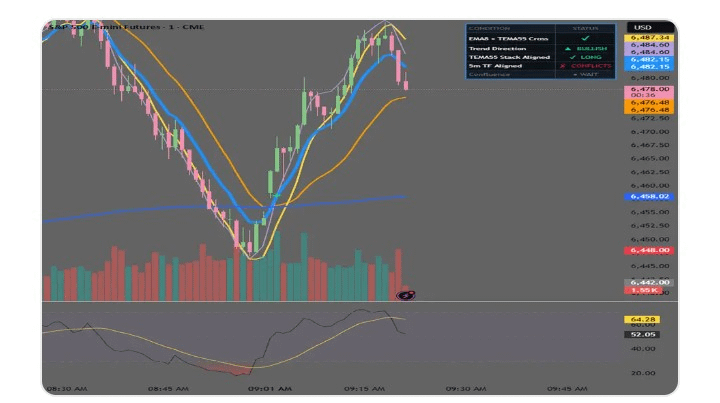
// — Checkliste Tabelle (oben rechts):
// ✔/✘ 8 EMA kreuzte 55 TEMA
// ▲/▼ Trendrichtung (bullish/bearish)
// ✔/✘ 55 TEMA Ausrichtung (über allem für kurz / unter allem für lang)
// ✔/✘ 5m Zeitrahmen stimmt überein (8 EMA vs 55 TEMA auf 5m)
// ============================================================
//@version=6
indicator(title = "NQ NY — EMA/TEMA Dashboard",
shorttitle = "EMA/TEMA Dashboard",
overlay = true,
max_labels_count = 500,
max_boxes_count = 100)
// ─────────────────────────────────────────────
// EINGABEN
// ─────────────────────────────────────────────
grpEma = "Gleitende Durchschnitte"
emaLen = input.int(8, "EMA Länge", minval=1, group=grpEma)
t13Len = input.int(13, "TEMA 13 Länge", minval=1, group=grpEma)
t21Len = input.int(21, "TEMA 21 Länge", minval=1, group=grpEma)
t55Len = input.int(55, "TEMA 55 Länge", minval=1, group=grpEma)
showT13 = input.bool(true, "Zeige 13 TEMA", group=grpEma)
showT21 = input.bool(true, "Zeige 21 TEMA", group=grpEma)
showVwap = input.bool(true, "Zeige VWAP", group=grpEma)
grpVis = "Visuals"
emaCol = input.color(#1E90FF, "8 EMA Farbe", group=grpVis)
t13Col = input.color(color.new(#B39DDB,0),"13 TEMA Farbe", group=grpVis)
t21Col = input.color(color.new(#FFD740,0),"21 TEMA Farbe", group=grpVis)
t55Col = input.color(color.new(#FF9800,0),"55 TEMA Farbe", group=grpVis)
vwapCol = input.color(color.new(#E040FB,0),"VWAP Farbe", group=grpVis)
// ─────────────────────────────────────────────
// BERECHNUNGEN FÜR GLEITENDE DURCHSCHNITTE
// ─────────────────────────────────────────────
tema(src, len) =>
e1 = ta.ema(src, len)
e2 = ta.ema(e1, len)
e3 = ta.ema(e2, len)
3 e1 - 3 e2 + e3
ema8 = ta.ema(close, emaLen)
t13 = tema(close, t13Len)
t21 = tema(close, t21Len)
t55 = tema(close, t55Len)
// VWAP (Sitzung)
[vwapVal, , ] = ta.vwap(hlc3, false, 1)
// ─────────────────────────────────────────────
// CHECKLISTENLOGIK
// ─────────────────────────────────────────────
// 1. Hat 8 EMA 55 TEMA gekreuzt? (ist derzeit auf einer Seite)
// Grün = ein Kreuz hat stattgefunden (ema8 != t55 Seite, d.h. sie sind nicht gleich/verwickelt)
// Wir verfolgen, ob ema8 über oder unter t55 ist als den Kreuzstatus
emaCrossedBull = ema8 > t55 // ema oberhalb gekreuzt → bullisch
emaCrossedBear = ema8 < t55 // ema unterhalb gekreuzt → bärisch
crossOccurred = emaCrossedBull or emaCrossedBear
// 2. Trendrichtung
isBullish = ema8 > t55
isBearish = ema8 < t55
// 3. 55 TEMA Ausrichtung
// Für SHORT: t55 sollte ÜBER allen anderen MAs sein (Preis unter allen = bärischer Stapel)
// Für LONG: t55 sollte UNTER allen anderen MAs sein (Preis über allen = bullischer Stapel)
t55AboveAll = t55 > ema8 und t55 > t13 und t55 > t21 // gut für SHORT
t55BelowAll = t55 < ema8 und t55 < t13 und t55 < t21 // gut für LONG
t55Aligned = t55AboveAll or t55BelowAll
// 4. 5-Minuten-Zeitrahmen-Ausrichtung (8 EMA vs 55 TEMA auf 5m)
ema8_5m = request.security(syminfo.tickerid, "5", ta.ema(close, 8), lookahead=barmerge.lookahead_off)
t55_5m_e1 = request.security(syminfo.tickerid, "5", ta.ema(close, 55), lookahead=barmerge.lookahead_off)
t55_5m_e2 = request.security(syminfo.tickerid, "5", ta.ema(t55_5m_e1, 55), lookahead=barmerge.lookahead_off)
t55_5m_e3 = request.security(syminfo.tickerid, "5", ta.ema(t55_5m_e2, 55), lookahead=barmerge.lookahead_off)
t55_5m = 3 t55_5m_e1 - 3 t55_5m_e2 + t55_5m_e3
tfAlignBull = ema8_5m > t55_5m // 5m bullisch stimmt mit aktuellem bullisch überein
tfAlignBear = ema8_5m < t55_5m // 5m bärisch stimmt mit aktuellem bärisch überein
tfAligned = (isBullish and tfAlignBull) or (isBearish and tfAlignBear)
// ─────────────────────────────────────────────
// KREUZERKENNUNG
// ─────────────────────────────────────────────
bullCross = ta.crossover(ema8, t55)
bearCross = ta.crossunder(ema8, t55)
// ─────────────────────────────────────────────
// PLOTS
// ─────────────────────────────────────────────
plot(t55, title="55 TEMA", color=t55Col, linewidth=2)
plot(showT21 ? t21 : na, title="21 TEMA", color=t21Col, linewidth=2)
plot(showT13 ? t13 : na, title="13 TEMA", color=t13Col, linewidth=1)
plot(ema8, title="8 EMA", color=emaCol, linewidth=4)
plot(showVwap ? vwapVal : na, title="VWAP", color=vwapCol, linewidth=1, style=plot.style_circles)
// Kreuzmarker — "+" Label an exakter Schnittstelle von 8 EMA und 55 TEMA platziert
crossPrice = math.avg(ema8, t55)
if bullCross
label.new(bar_index, crossPrice,
text = "+",
textcolor = #00E676,
style = label.style_none,
size = size.huge)
if bearCross
label.new(bar_index, crossPrice,
text = "+",
textcolor = #FF1744,
style = label.style_none,
size = size.huge)
// ─────────────────────────────────────────────
// DASHBOARD-TABELLE
// ─────────────────────────────────────────────
var table dash = table.new(
position = position.top_right,
columns = 2,
rows = 6,
bgcolor = color.new(#0D1117, 10),
border_width = 1,
border_color = color.new(#2A3A4A, 0),
frame_width = 2,
frame_color = color.new(#1E90FF, 60))
// Farben
C_GREEN = #00E676
C_RED = #FF1744
C_WHITE = #EAEAEA
C_MUTED = #607080
C_HEADER = #0D1117
C_BULL = #00E676
C_BEAR = #FF1744
if barstate.islast
// ── Kopfzeile ──────────────────────────────
table.cell(dash, 0, 0, "BEDINGUNG",
text_color=color.new(C_MUTED, 0),
text_size=size.small,
bgcolor=color.new(#141C27, 0),
text_halign=text.align_left)
table.cell(dash, 1, 0, "STATUS",
text_color=color.new(C_MUTED, 0),
text_size=size.small,
bgcolor=color.new(#141C27, 0),
text_halign=text.align_center)
// ── Zeile 1: Kreuzung ────────────────────
table.cell(dash, 0, 1, "EMA8 × TEMA55 Kreuz",
text_color=C_WHITE,
text_size=size.small,
bgcolor=color.new(#0D1117, 0),
text_halign=text.align_left)
table.cell(dash, 1, 1,
crossOccurred ? "✔" : "✘",
text_color = crossOccurred ? C_GREEN : C_RED,
text_size = size.normal,
bgcolor = color.new(#0D1117, 0),
text_halign= text.align_center)
// ── Zeile 2: Trendrichtung ───────────────
trendTxt = isBullish ? "▲ BULLISH" : isBearish ? "▼ BEARISH" : "─ NEUTRAL"
trendColor = isBullish ? C_BULL : isBearish ? C_BEAR : C_MUTED
table.cell(dash, 0, 2, "Trendrichtung",
text_color=C_WHITE,
text_size=size.small,
bgcolor=color.new(#0D1117, 0),
text_halign=text.align_left)
table.cell(dash, 1, 2, trendTxt,
text_color = trendColor,
text_size = size.small,
bgcolor = color.new(#0D1117, 0),
text_halign= text.align_center)
// ── Zeile 3: 55 TEMA Stapel-Ausrichtung ───────
// Zeige, wofür es ausgerichtet ist (long oder short), oder ✘, wenn keines von beiden
stackTxt = t55BelowAll ? "✔ LONG" :
t55AboveAll ? "✔ SHORT" : "✘"
stackColor = t55Aligned ? C_GREEN : C_RED
table.cell(dash, 0, 3, "TEMA55 Stapel Ausgerichtet",
text_color=C_WHITE,
text_size=size.small,
bgcolor=color.new(#0D1117, 0),
text_halign=text.align_left)
table.cell(dash, 1, 3, stackTxt,
text_color = stackColor,
text_size = size.small,
bgcolor = color.new(#0D1117, 0),
text_halign= text.align_center)
// ── Zeile 4: 5m TF-Ausrichtung ───────────────
tfTxt = tfAligned ? "✔ STIMMT ÜBEREIN" : "✘ KONFLIKTE"
tfColor = tfAligned ? C_GREEN : C_RED
table.cell(dash, 0, 4, "5m TF Ausgerichtet",
text_color=C_WHITE,
text_size=size.small,
bgcolor=color.new(#0D1117, 0),
text_halign=text.align_left)
table.cell(dash, 1, 4, tfTxt,
text_color = tfColor,
text_size = size.small,
bgcolor = color.new(#0D1117, 0),
text_halign= text.align_center)
// ── Zeile 5: Alle-Grün Zusammenfassung ─────────────
allGreen = crossOccurred and t55Aligned and tfAligned
summaryTxt = allGreen ? "● KONFLUENT" : "● WARTEN"
summaryCol = allGreen ? C_GREEN : C_MUTED
table.cell(dash, 0, 5, "Konfluenz",
text_color = C_MUTED,
text_size = size.small,
bgcolor = color.new(#141C27, 0),
text_halign= text.align_left)
table.cell(dash, 1, 5, summaryTxt,
text_color = summaryCol,
text_size = size.small,
bgcolor = color.new(#141C27, 0),
text_halign= text.align_center)