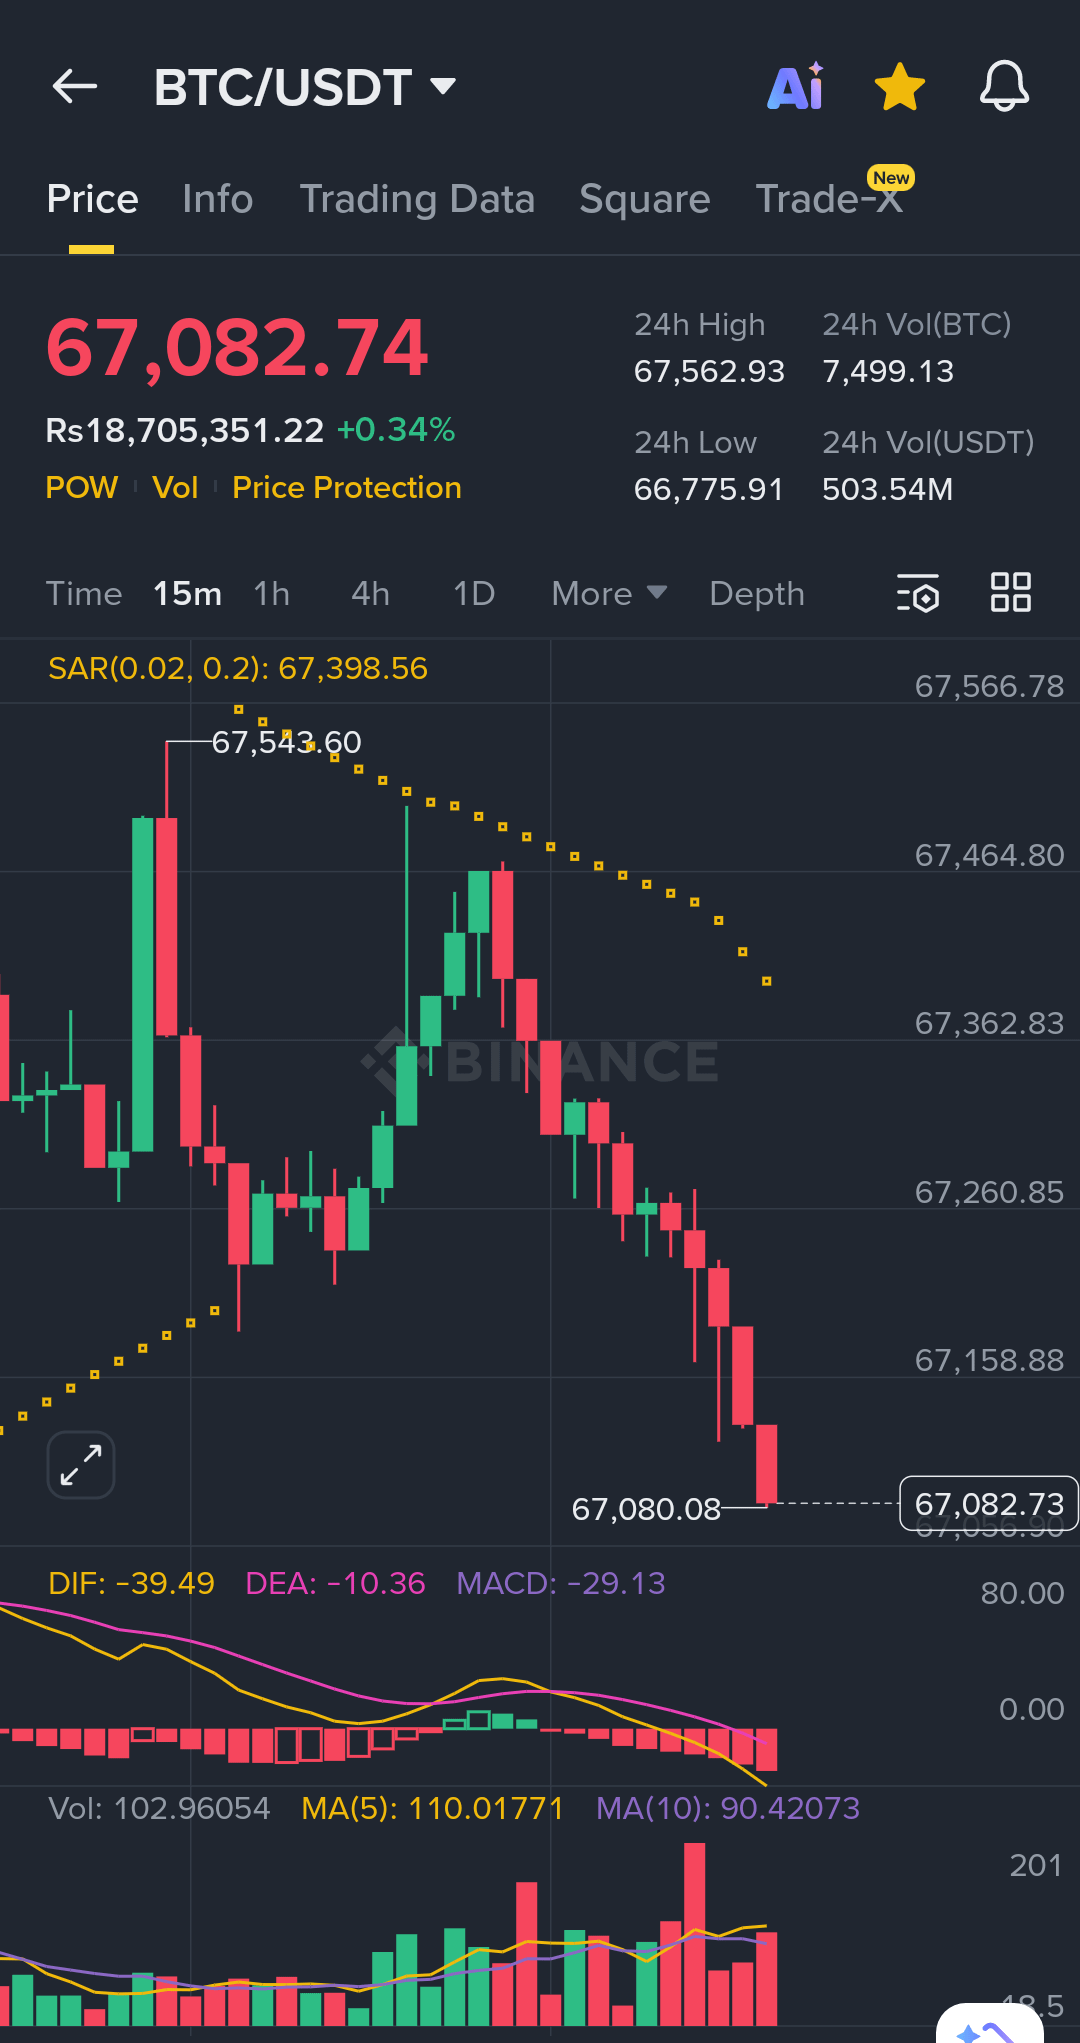
Bitcoin is currently trading at $67,082.74-on the 15-minute timeframe. Over the past 24 hours, BTC has ranged between a high of $67,562.93 and a low of $66,775.91, reflecting moderate volatility. The total 24h volume stands at 7,499.13 BTC (~$503.54M USDT), indicating decent liquidity but no explosive directional commitment.
Technical Indicators
SAR (0.02, 0.2) – Bearish Flip
The Parabolic SAR value is 67,398.56, which sits above the current price. This is a classic bearish signal on the selected timeframe, suggesting that the short-term trend has turned downward and that each bounce may face resistance near the SAR level. Traders often treat SAR as a trailing stop – being above price implies selling pressure.
MACD – Confirming Weakness
· DIF: -39.49
· DEA: -10.36
· MACD Histogram: -29.13
All three lines are negative, with the DIF well below the DEA. The histogram is expanding in the red zone, reinforcing bearish momentum. This configuration typically indicates that sellers remain in control for the current 15‑minute cycle, and any upside attempts are likely to be short‑lived unless the histogram starts shrinking.
Volume Analysis
· Current Volume (candle): 102.96
· MA(5): 110.02
· MA(10): 90.42
Volume is slightly below its 5‑period moving average but still above the 10‑period average. This suggests a mild contraction of immediate buying/selling interest compared to the last five candles. However, the fact that volume remains above the 10‑period MA implies that the market is not completely dry – enough participation exists to sustain moves, but currently biased to the downside.
RSI Anomaly
The screenshot shows an RSI value of 18,705,351.22 – likely a data display error or a misinterpretation of another metric (possibly cumulative volume or a custom indicator). Standard RSI oscillates between 0 and 100. Therefore, this reading should be disregarded. We rely instead on SAR, MACD, and volume for technical insight.
Key Levels to Watch
· Immediate Resistance: $67,398.56 (SAR) – a break and close above this would flip the SAR to a bullish signal.
· Secondary Resistance: $67,562.93 (24h high) – a breakout above the daily high could attract fresh buyers.
· Support: $66,775.91 (24h low) – a breakdown below this level would open the door toward the $66,500 area.
Market Sentiment & Outlook
On the 15‑minute chart, BTC is displaying a clear bearish structure: price below SAR, negative MACD, and volume failing to exceed its short‑term average. The 24h range remains relatively tight, suggesting that the market is still deciding its next major direction. However, intraday scalpers should lean short unless price reclaims the SAR level with conviction.
Short‑term strategy: Watch for a retest of the SAR near $67,400. If price fails to break above, expect another leg down toward the daily low. Conversely, a clean break above $67,400 could trigger a short squeeze targeting $67,560.
Disclaimer: This analysis is based on a single 15‑minute snapshot and does not constitute financial advice. Always use proper risk management.


#AnthropicBansOpenClawFromClaude
#USNoKingsProtests #GoogleStudyOnCryptoSecurityChallenges