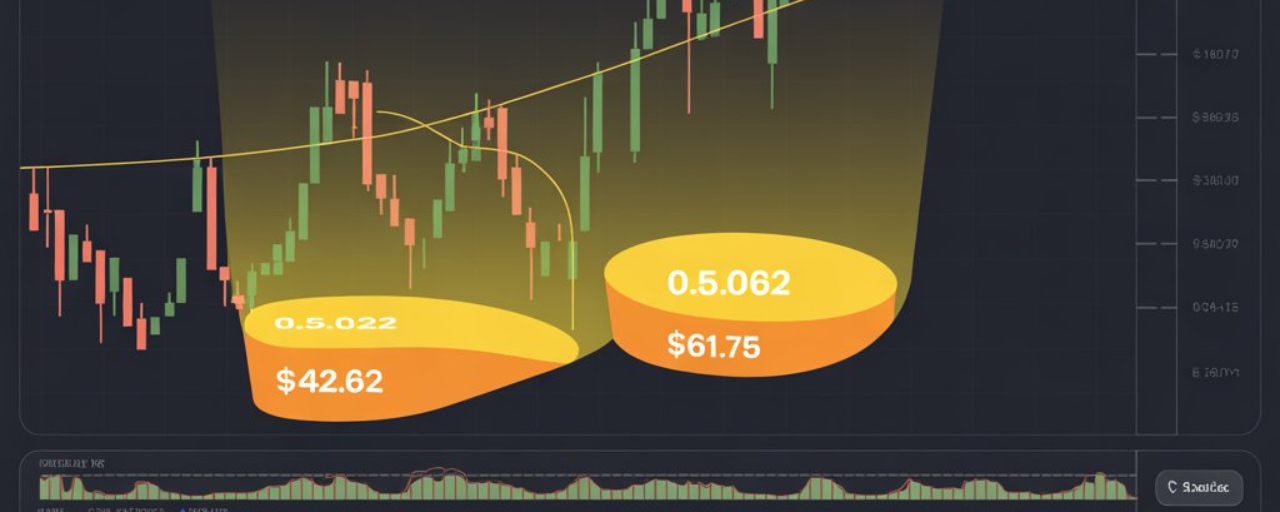
$SOL has dropped into the 0.5–0.618 Fibonacci retracement zone ($42.62–$61.75), a level often associated with potential reversals after deep corrections. This “buy zone” is where traders historically watch for accumulation.
Recent moves show 1.4M $SOL moved to exchanges, but that doesn’t always signal selling—it can also be for collateral or trading setups. Large holders’ behavior can influence price without causing immediate dumps.
If $SOL holds this support, historical patterns suggest it could regain previous highs ($89, $210). Watching these key levels alongside $BTC stability helps understand potential long-term trends.
This illustrates how Fibonacci zones and exchange flows can guide technical analysis in crypto.