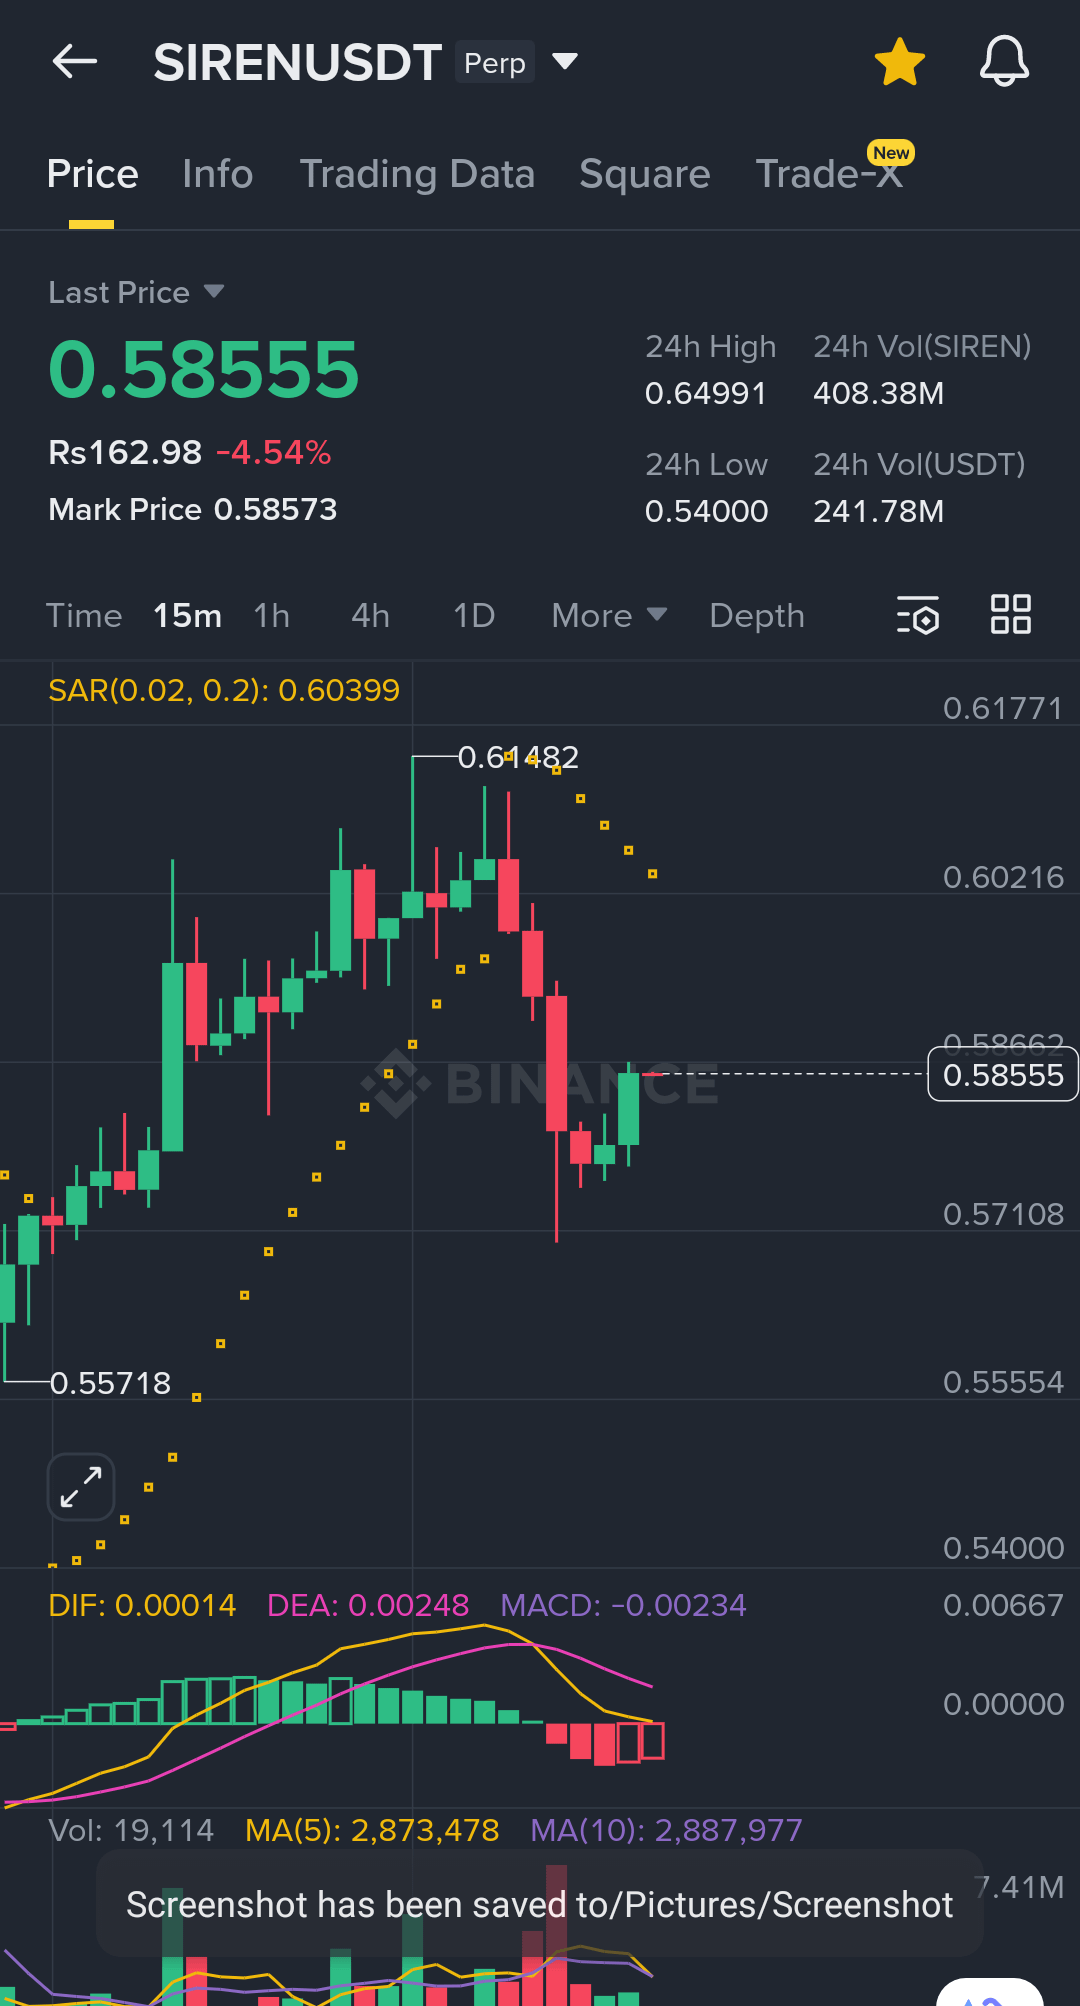
The SIREN/USDT perpetual pair is currently trading around 0.5855, showing a short-term bearish correction after recently reaching a local high near 0.6148. The price action on the 15-minute timeframe reflects a shift from bullish momentum into a consolidation and minor downtrend phase.
Initially, the market showed a strong upward move, forming higher highs and higher lows, which is a classic bullish structure. This rally pushed the price from around 0.5570 to above 0.6100, indicating strong buying interest and momentum. However, after hitting the resistance zone near 0.6140–0.6150, the price failed to break higher and started reversing.
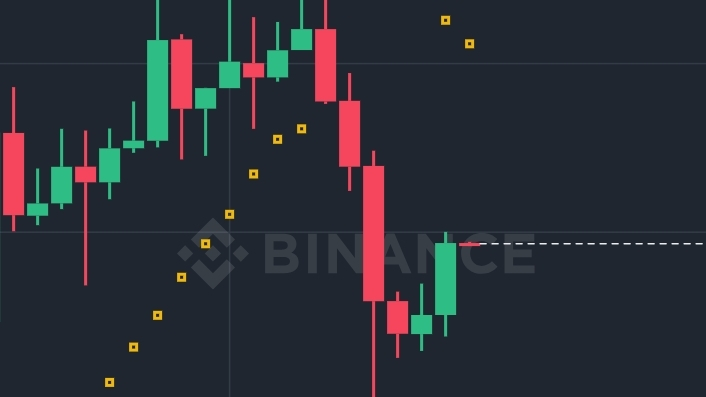
The appearance of consecutive red candles after the peak suggests profit-taking by traders and the entry of sellers into the market. This rejection from resistance confirms that the 0.61–0.615 zone is a strong supply area. As a result, the price dropped sharply to around 0.5710, forming a lower low in the short term.
Looking at the Parabolic SAR (0.02, 0.2) indicator, the dots have shifted above the price, signaling a bearish trend continuation. This indicator supports the idea that sellers currently have control in the market.
The MACD (Moving Average Convergence Divergence) also confirms bearish momentum. The MACD line has crossed below the signal line, and the histogram has turned negative. This indicates increasing selling pressure and weakening bullish strength. However, the histogram bars are relatively small, which may suggest that the bearish momentum is not extremely strong and could slow down.
Volume analysis shows moderate activity, with no major spike during the recent drop. This suggests that the sell-off is not driven by panic but rather by normal market correction behavior.
From a support and resistance perspective:
Immediate Resistance: 0.6000 – 0.6050
Major Resistance: 0.6140 – 0.6150
Immediate Support: 0.5710
Strong Support: 0.5550 – 0.5570
Currently, the price is attempting a small recovery after bouncing from the 0.5710 support zone, forming a minor bullish reaction. If the price manages to break and hold above 0.6000, it could retest the previous high. However, failure to break this level may lead to another rejection and a possible drop toward 0.5550.
In conclusion, the market is in a short-term bearish correction within a larger bullish structure. Traders should watch for confirmation signals before entering positions. A breakout above resistance could restart the uptrend, while a breakdown below support may lead to further downside.
If you want, I can also give you a proper trade setup (entry, SL, TP) for this chart 👍
#US&IranAgreedToATwo-weekCeasefire