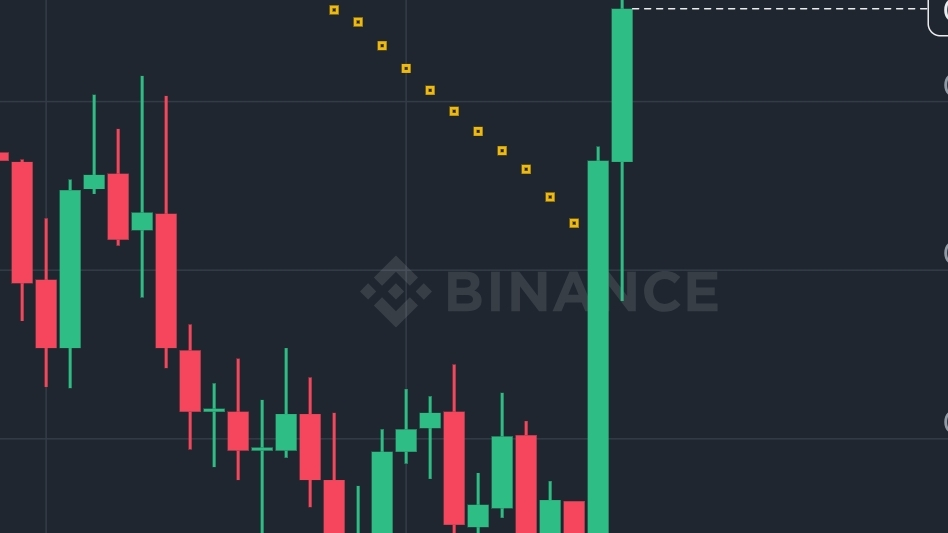
$recent period of consolidation and downward pressure. On the 15-minute timeframe, price action shows a sharp reversal from the local low around 0.7622, followed by an aggressive upward move reaching near 0.8248, indicating renewed buying interest and momentum entering the market.
One of the most notable signals comes from the Parabolic SAR indicator, which has flipped below the price after a prolonged bearish phase. This shift typically suggests a change in trend direction, favoring bulls in the short term. The consistent placement of SAR dots under the candles confirms that the current upward movement is supported by trend-following indicators.
Looking at the MACD (Moving Average Convergence Divergence), the histogram has turned positive, and the MACD line has crossed above the signal line. This crossover is a classic bullish signal, indicating increasing momentum and the possibility of further upside continuation. Additionally, the expansion of green histogram bars suggests that buying pressure is accelerating rather than weakening.
Volume analysis further strengthens the bullish outlook. There is a visible spike in trading volume during the recent breakout candle, which confirms that the price move is backed by strong market participation rather than low-liquidity fluctuations. High volume during upward moves is generally considered a healthy sign for trend sustainability.
From a price structure perspective, the market has successfully broken above the short-term resistance zone around 0.80–0.81, which now acts as a potential support area. If the price holds above this region, it could pave the way for a continuation toward the next resistance near 0.83–0.85. However, traders should remain cautious of possible pullbacks, as rapid price increases are often followed by short-term corrections.
On the downside, immediate support lies around 0.80, followed by a stronger support zone near 0.76, which previously acted as a reversal point. A break below these levels could invalidate the current bullish structure and shift momentum back to the bears.
In conclusion, SIREN/USDT is currently exhibiting strong bullish momentum supported by technical indicators such as SAR and MACD, along with increasing volume. While the short-term outlook remains positive, traders should monitor key support and resistance levels closely and manage risk appropriately. If the bullish momentum sustains, further upside can be expected, but a healthy retracement should not be ruled out in the near term.
If you want, I can also �turn this into a Telegram trading signal format (Entry, SL, TP) 👍


#BitcoinPriceTrends #CZ’sBinanceSquareAMA #GoldmanSachsFilesforBitcoinIncomeETF #EthereumFoundationUnveils$1MAuditSubsidyProgram #KevinWarshDisclosedCryptoInvestments