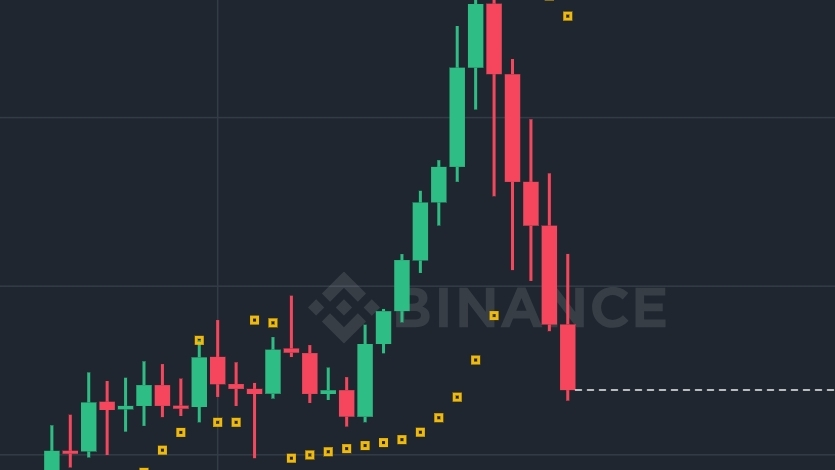
phase after a strong bullish rally, as reflected in the chart. The asset recently surged to a 24-hour high of approximately 2.2380, gaining over 100%, which indicates intense buying pressure and strong speculative interest. However, the current price near 1.65 USDT shows that the market has entered a short-term pullback, likely driven by profit-taking and weakening momentum.
From a technical perspective, the price action reveals a classic parabolic rise followed by a correction. The rapid upward movement created a steep trend, which is often unsustainable in the short term. As a result, sellers have stepped in after the peak, pushing the price downward with consecutive bearish candles. This suggests that early buyers are locking in profits while new buyers are hesitant to enter at elevated levels.
The Parabolic SAR (Stop and Reverse) indicator is currently positioned above the price, signaling a potential trend reversal or at least a continuation of the short-term bearish momentum. This is a key indication that the previous bullish trend has weakened. Additionally, the MACD (Moving Average Convergence Divergence) shows a bearish crossover, with the MACD line moving below the signal line and histogram bars turning negative. This confirms that momentum has shifted in favor of the bears.
Volume analysis further supports this outlook. While there was a spike in trading volume during the upward rally, the recent red candles are also accompanied by significant volume, indicating strong selling pressure. This type of volume behavior often suggests that the correction may continue until a strong support level is found.
Key support appears to be forming around the 1.55–1.56 USDT zone, which aligns with a recent consolidation area. If the price holds this level, a potential bounce or consolidation phase could occur. On the upside, resistance is now likely near 1.80–2.00 USDT, where the price previously struggled during the decline. A break above this zone would be required to restore bullish confidence.
In conclusion, the SIREN/USDT market is currently in a short-term bearish correction within a broader bullish context. Traders should remain cautious, as volatility is high and rapid price swings are possible. Conservative traders may prefer to wait for confirmation of support before entering new positions, while aggressive traders might look for short-term opportunities based on momentum signals. Risk management remains essential, especially in highly volatile markets like this one.$SIREN


#USInitialJoblessClaimsBelowForecast #BitcoinPriceTrends The SIREN/USDT perpetual market is currently experiencing a sharp corrective #CZ’sBinanceSquareAMA #CantorFitzgeraldDonates$10MilliontoCryptoPAC #GoldmanSachsFilesforBitcoinIncomeETF