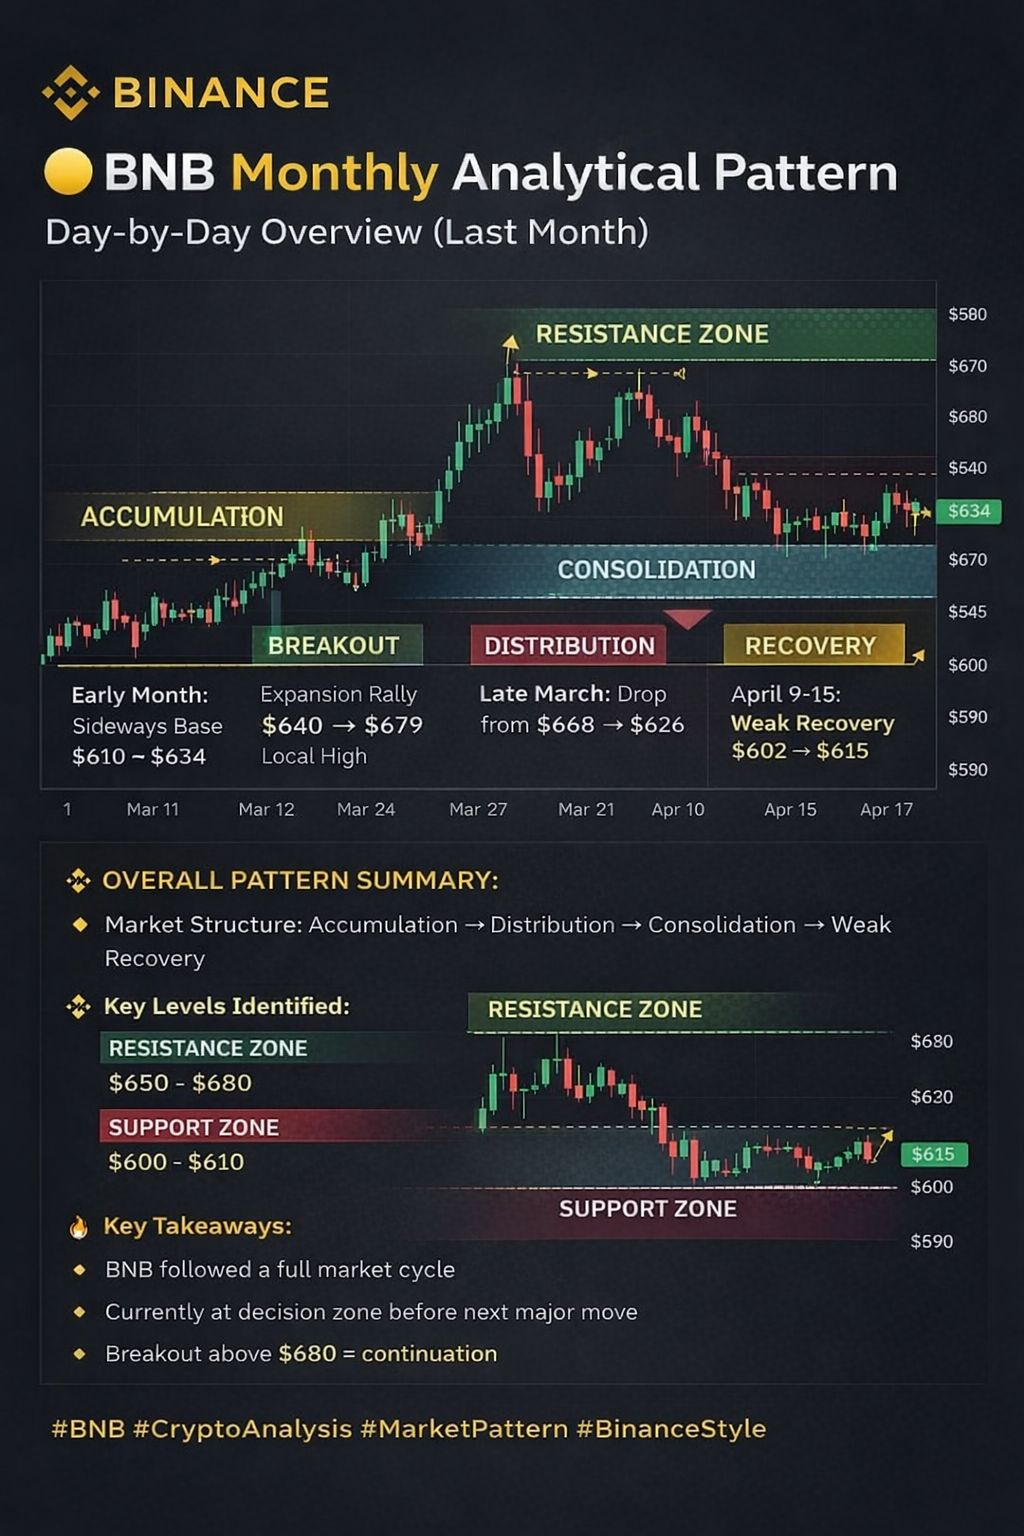
🟡 BNB Monthly Analytical Pattern | Day-by-Day Structure (Last 30 Days)
Based on recent historical data (March–April 2026), BNB shows a clear rotational pattern with phases of accumulation, expansion, and correction. �
YCharts +1
📊 Phase 1: Early Month — Base Formation (March 1–10)
Price range: ~$610 → $634
Structure: Sideways accumulation
Behavior:
Multiple small up/down candles
Buyers defending support around $610–620
Insight: Market builds liquidity → no clear trend yet
👉 Typical Binance view: “Low volatility zone before breakout”
🚀 Phase 2: Expansion Rally (March 11–17)
Price range: $640 → $679 (local high)
Structure: Strong bullish trend
Behavior:
Consecutive higher highs & higher lows
Momentum-driven breakout
Key move:
March 17 peak near $679 �
YCharts
👉 Trend: Impulse wave (buyers in control)
⚠️ Phase 3: Distribution & Pullback (March 18–22)
Price drop: $668 → $626
Structure: Reversal zone
Behavior:
Sharp red candles after peak
Lower highs begin forming
Insight:
Profit-taking + weakening momentum
👉 Classic pattern: Distribution → correction
🔄 Phase 4: Range Consolidation (March 23–April 10)
Price range: $600 → $645
Structure: Sideways channel
Behavior:
Frequent up/down swings
No strong breakout continuation
Example:
March 24 close near $638 �
Twelve Data
👉 Market condition: Indecision phase
📈 Phase 5: Short-Term Recovery (April 9–15)
Price range: $602 → $615
Structure: Minor uptrend attempt
Behavior:
Gradual recovery from local lows
Weak bullish continuation
Example:
April 14 close ~$614 �
CoinGecko
👉 Signal: Buyers returning but not dominant
🧠 Overall Pattern Summary (Binance Style)
🔷 Market Structure:
Accumulation → Breakout → Distribution → Consolidation → Weak Recovery
📊 Key Levels Identified
Support Zone: $600 – $610
Resistance Zone: $650 – $680
⚡ Volatility Insight
High volatility during breakout phase
Compression during consolidation
Currently: low momentum environment
🔍 Analytical Conclusion
BNB is not in a strong trend right now — instead, it’s moving in a range-bound cycle after a completed bullish impulse.
👉 Bullish Scenario:
Break above $650–680 → continuation trend
👉 Bearish Scenario:
Break below $600 → deeper correction
👀 Trading Psychology (Important)
Early month = smart money accumulation
Mid month = retail FOMO (pump phase)
Late month = profit-taking + consolidation
📌 Final Take:
BNB’s last 30 days show a complete market cycle, and currently it’s in a decision zone before the next major move.
DYOR