Binance
📈 Technical Analysis
May 2, 2026 · 03:51 UTC
Live Chart⏱ 1H Timeframe🔶 Binance Spot
$POL /USDT Is Setting Up a Bullish Structure — Here's What the Chart Tells Us
A Smart Money Concepts (SMC) breakdown of POL's 1-hour chart on Binance — including key support zones, resistance levels, BOS & CHoCH signals, and the two scenarios traders are watching right now.
Current Price
$0.0959
▲ +0.31% (1h)
Weak High
$0.0975
⚡ Key Resistance
Strong Low
$0.0900
🔒 Major Support
Volume (24h)
803.9K
POL
01
Chart Overview — What Are We Looking At?
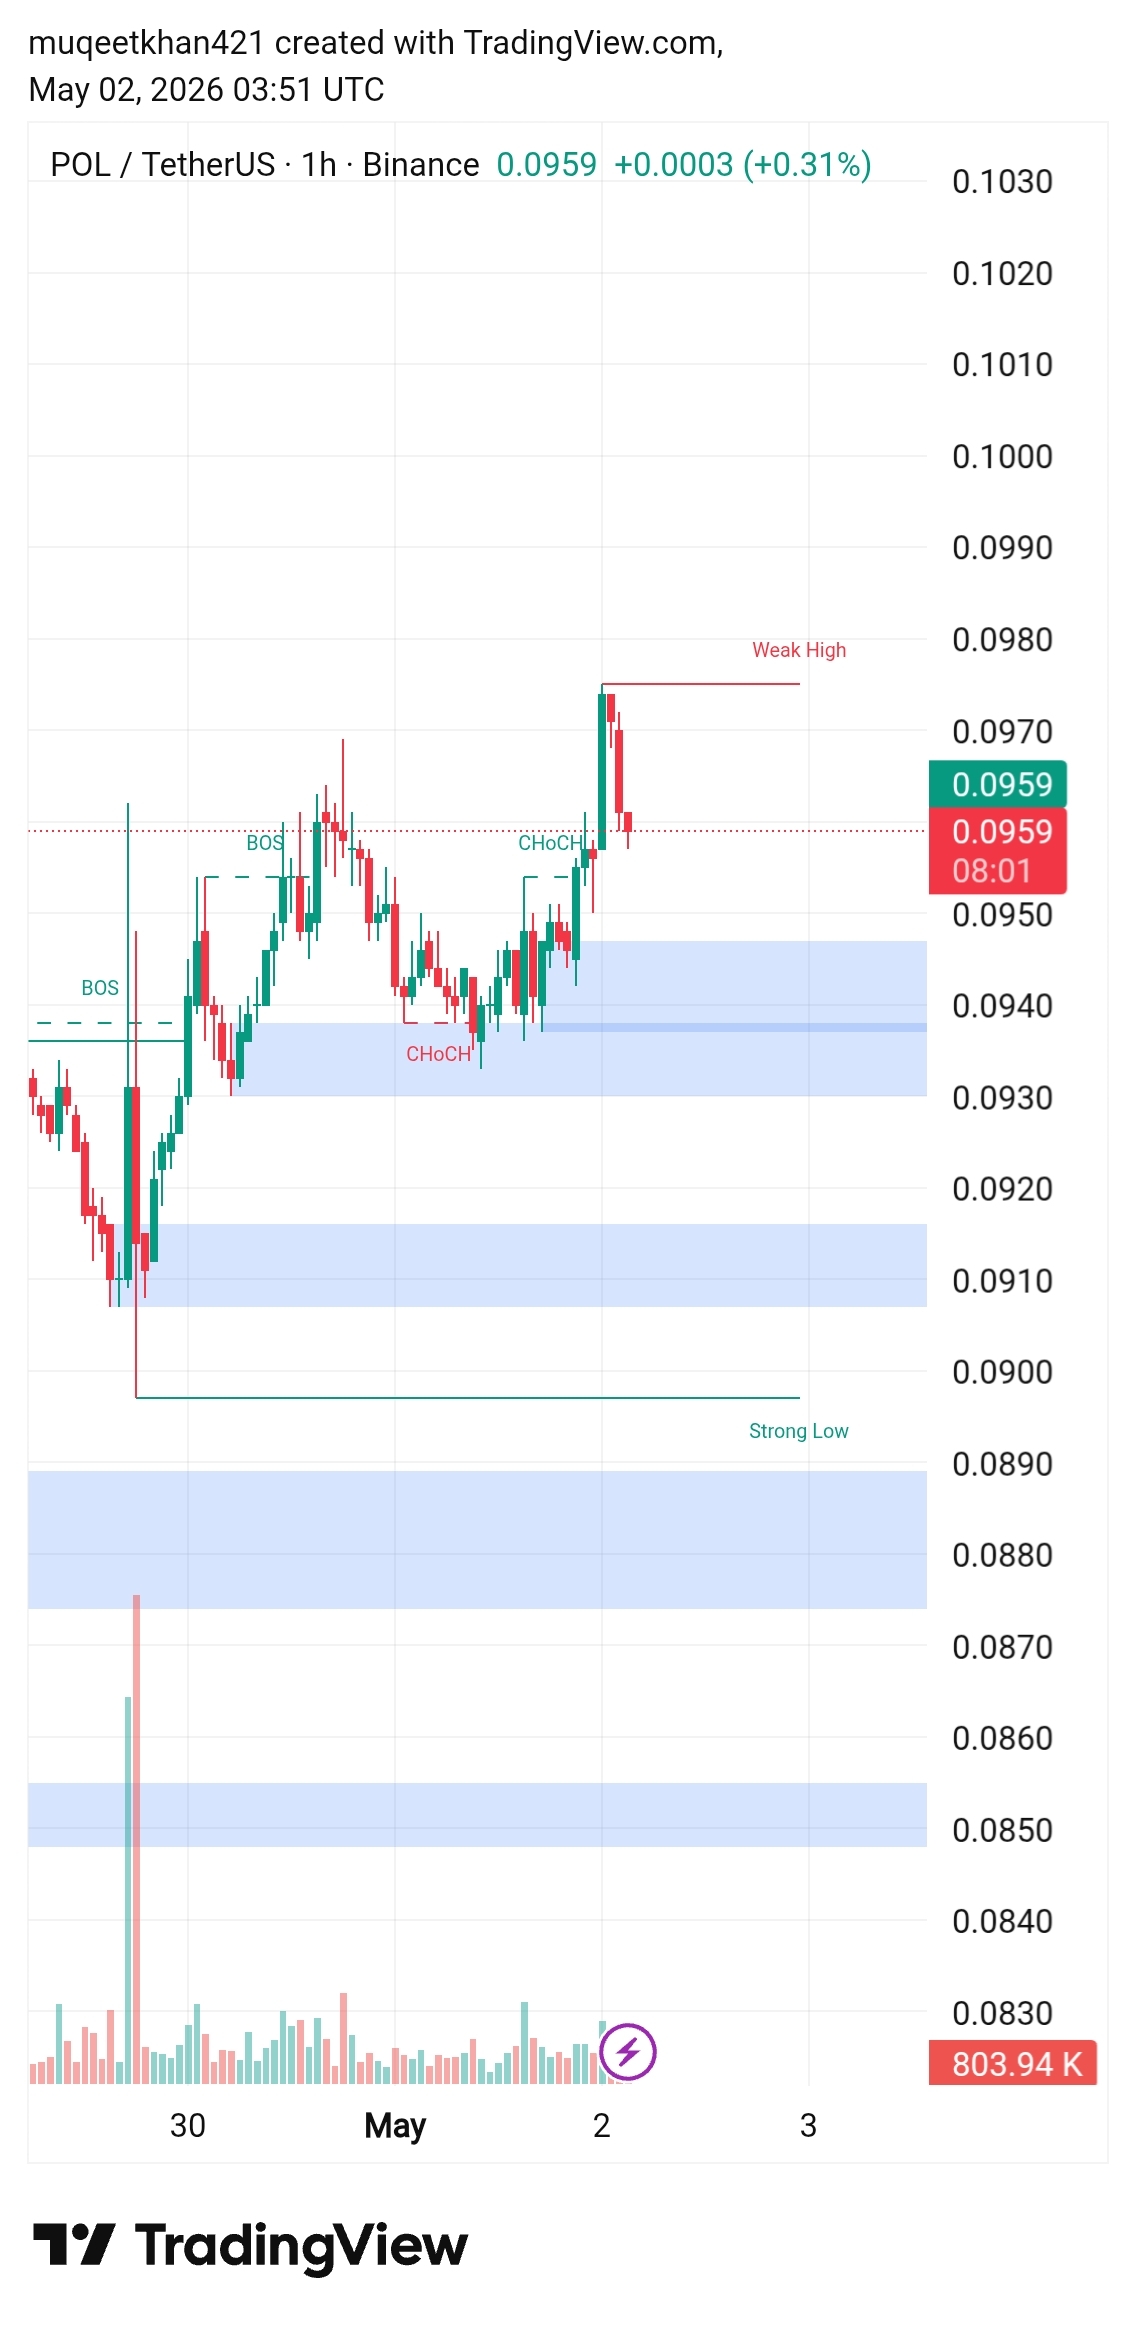
This is the POL/USDT 1-hour chart on Binance, captured on May 2, 2026 at 03:51 UTC. POL — formerly known as MATIC — is Polygon's native token, rebranded as part of the network's 2.0 upgrade. The chart covers roughly April 29 to May 2, showing a full market cycle of recovery, breakout, and retest.
The analysis is built using Smart Money Concepts (SMC) — a price action methodology that tracks institutional order flow, liquidity grabs, and structural shifts. You'll see labels like BOS, CHoCH, Weak High, and Strong Low — all explained below.
POL/USDT · 1H · Binance · May 2, 2026 03:51 UTC · Created by muqeetkhan421 on TradingView
02
SMC Concepts on This Chart — Explained Simply
If you're new to Smart Money Concepts, here's a quick breakdown of every label visible on the chart:
📈
BOS — Break of Structure
Price breaks a previous swing high, confirming the trend is bullish. Two BOS signals appeared — at ~$0.0935 and ~$0.0955 — confirming upward momentum.
🔄
CHoCH — Change of Character
A temporary reversal signal — price breaks a short-term low before resuming the larger trend. Two CHoCH events marked on chart show short pullbacks within the bullish structure.
⚡
Weak High
The recent swing high at ~$0.0975 is "weak" — it has not been confirmed as a strong structural level. Price often returns to test or break this level.
🔒
Strong Low
The base of the entire move near ~$0.0900. This is where smart money accumulated. Breaking below this would invalidate the bullish setup entirely.
🟦
Demand Zones (Blue Boxes)
Three blue shaded areas mark institutional demand zones — $0.0910–$0.0920, $0.0930–$0.0940, and $0.0875–$0.0885. These are buy zones for smart money setups.
〰️
Dotted Line (~$0.0955)
A midline equilibrium level. Price is currently hovering just above this — watching whether it holds as support or gets rejected is the key short-term question.
03
Key Price Levels to Watch
Here are all the critical levels derived from the chart. These are the prices where decisions get made:
LevelPriceTypeWhat It MeansWeak High$0.0975ResistanceImmediate target for bulls. Break above = continuation to $0.1000+Current Price$0.0959NowAt decision zone — above equilibrium dotted lineEquilibrium Line$0.0955Key LevelMust hold as support for bullish bias to remain intactDemand Zone 1$0.0930–$0.0940SupportFirst major demand block — strong reaction expected hereDemand Zone 2$0.0910–$0.0920SupportDeep demand zone — high-probability reversal area for swing tradesDemand Zone 3$0.0875–$0.0885Deep SupportLowest demand block — only relevant in a bearish continuationStrong Low$0.0900InvalidationBreak and close below this = full bullish structure invalidated
04
Full Structure Breakdown — The Story of This Chart
The chart tells a clear story in three phases. It started with a sharp sell-off from the left side — price dropped to the Strong Low area near $0.0900, which is where institutional accumulation began.
From there, price made its first BOS (Break of Structure) around $0.0935, signaling that bulls had taken control. However, it quickly showed a CHoCH (Change of Character) — a short pullback that retested the demand zone near $0.0930–$0.0940. This is classic smart money behavior: break structure, pull back to sweep liquidity, then continue.
The second BOS around $0.0955 followed by a push to the Weak High at $0.0975 was the most significant bullish move on the chart — price expanded nearly 4% in a few hours, driven by a volume spike visible in the bottom panel.
After tagging the Weak High, price sharply rejected back to the equilibrium level (~$0.0955) where it currently sits. This pullback is healthy — a sign that price is seeking liquidity before its next directional move. The key question now is: does it bounce here, or does it pull deeper into the $0.0930–$0.0940 demand zone?
📌 Current Structure: Higher highs + higher lows on the 1H = bullish market structure. The overall trend remains upward as long as price holds above the $0.0930 demand block.
05
Two Scenarios Traders Are Watching
Based on the current structure, here are the two most likely outcomes over the next 12–24 hours:
🟢 Bullish Scenario — Continuation
TriggerHold above $0.0955
Target 1$0.0975 (Weak High)
Target 2$0.1000 (Round Number)
Stop LossBelow $0.0940
ConfidenceModerate–High
🔴 Bearish Scenario — Pullback First
TriggerBreak below $0.0955
Target 1$0.0940 (Demand Zone 1)
Target 2$0.0915 (Demand Zone 2)
InvalidationBreak above $0.0975
ConfidenceModerate
The bearish scenario doesn't mean the bullish setup is broken. A healthy pullback to $0.0930–$0.0940 would actually create a higher-probability long entry for swing traders looking to ride the next leg up toward $0.1000.
06
How to Trade This Setup — Practical Tips
1Don't chase the current price at $0.0959. Ideal entries are at the demand zones ($0.0930–$0.0940), not at the midpoint. Wait for price to come to you.
2Watch for confirmation candles. Before entering a long trade at any demand zone, look for a bullish engulfing or a strong close above the zone's upper boundary on the 1H chart.
3Set your stop loss below $0.0900 (Strong Low). If price breaks this level with strong volume, the entire bullish setup is invalidated and a deeper move lower is likely.
4Take partial profits at the Weak High ($0.0975). Book 50% of your position there, then let the rest run toward $0.1000 with a trail stop.
5Always check the higher timeframe (4H or Daily) before entering. The 1H structure is bullish, but make sure it aligns with the larger trend to avoid getting caught in a fakeout.
⚠️ Disclaimer: This article is for educational and informational purposes only. Nothing here constitutes financial or investment advice. Cryptocurrency trading involves significant risk of loss. Always do your own research and consult a qualified financial advisor before making any trading decisions. Past chart patterns do not guarantee future price movements.

@Polygon #U.S.SenatorsBarredfromTradingonPredictionMarkets #U.S.SenatorsBarredfromTradingonPredictionMarkets