This is a classic short-term breakout followed by early pullback structure on the 15-minute chart for BABY/USDT.
Here’s the straight read:
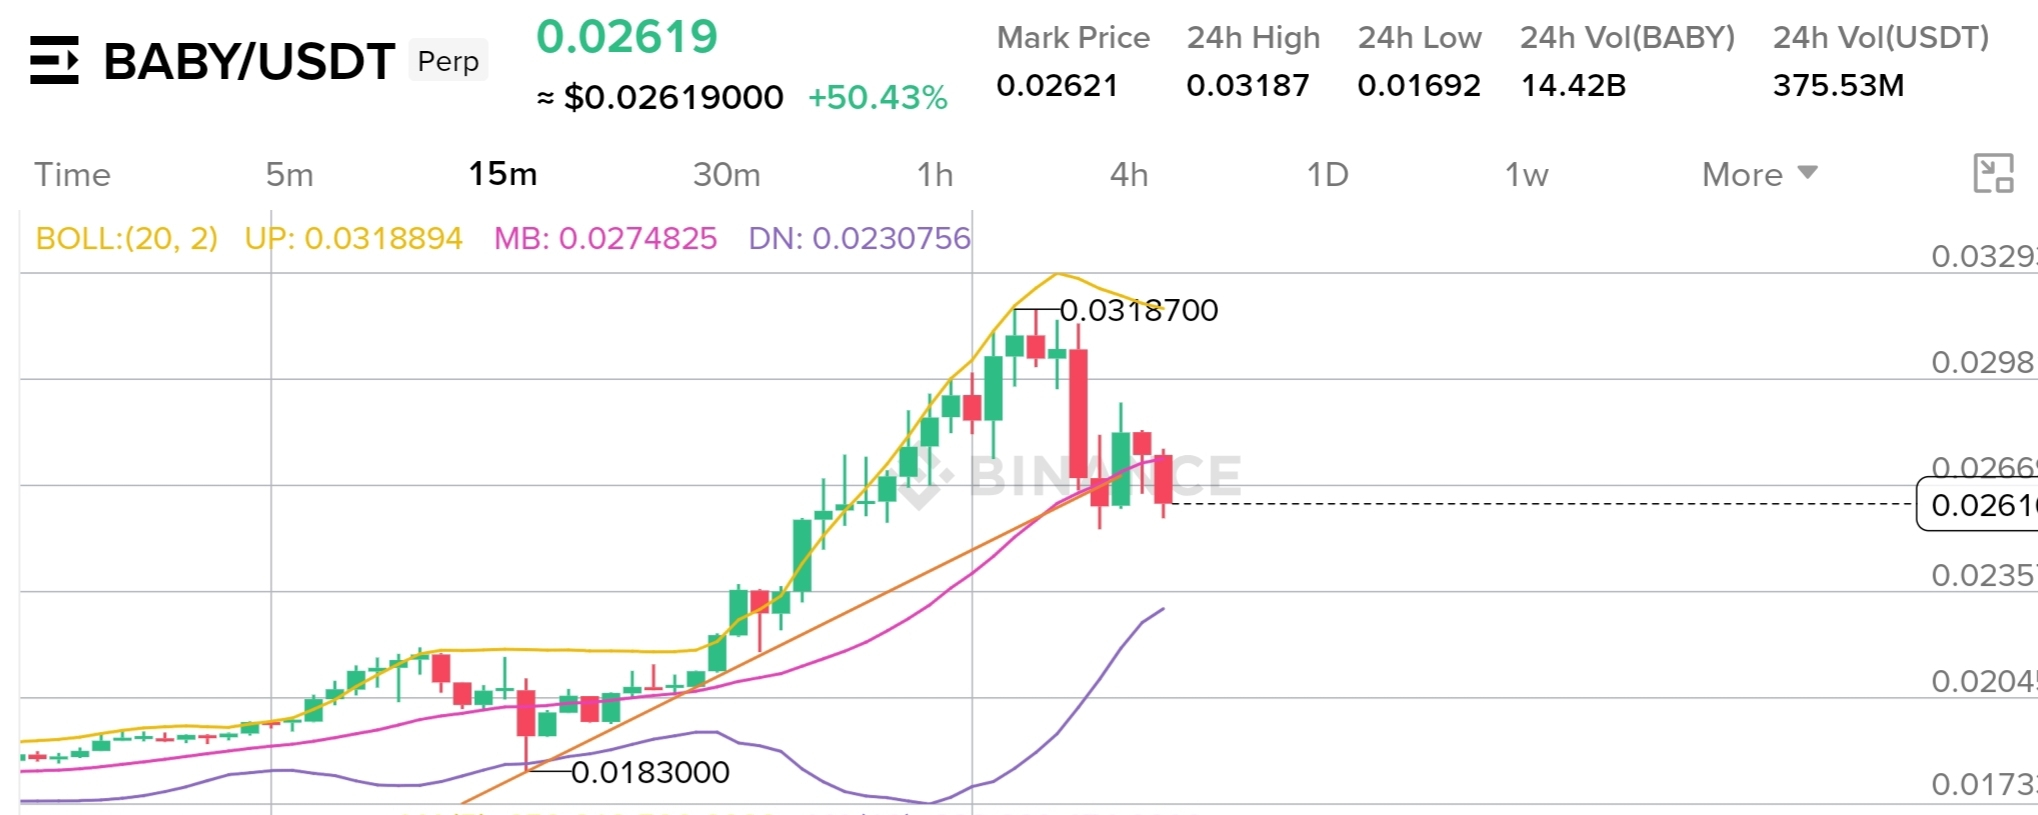
1. Strong momentum phase (bullish impulse)
Price exploded from around 0.0183 → 0.0318.
That’s not normal organic growth — it’s aggressive buying (likely hype + leverage).
Candles are clean and stacked → strong trend, no real resistance during the move.
2. Topping behavior
Around 0.0318, you see rejection wicks and slowing momentum.
This is where early buyers start taking profit.
Price touches upper Bollinger Band → overextended.
3. Pullback + volatility spike
Sharp red candle down shows long liquidation or profit-taking.
Now price is sitting around 0.026 area, near the mid Bollinger Band (MB ~0.0275).
That’s a key zone — it acts like a short-term trend decision point.
4. Volume confirms the story
Volume increased during the pump → healthy.
But also high on the dump → meaning sellers are active now, not just a quiet retrace.
What this means (no sugar-coating):
The trend is still bullish, but momentum is cooling off.
This is not a clean continuation yet — it's in a decision phase.
Key levels to watch:
Resistance: 0.0298 – 0.0318
If price breaks this again → continuation likely.
Support: 0.0255 – 0.0230
If this fails → deeper correction.
Realistic scenarios:
Bullish case:
Holds above ~0.025–0.026
Consolidates
Then pushes again → second leg up
Bearish case:
Loses 0.025 zone
Then you’ll see a drop toward 0.023 or even 0.020
My blunt take:
This is post-pump structure. Chasing here is risky.
Smart money usually waits for:
either a clean consolidation
or a retest of lower support
Right now? It’s no-man’s land — not a clean entry unless you’re scalping.
What are your thoughts on this ? Comment are appreciated.