
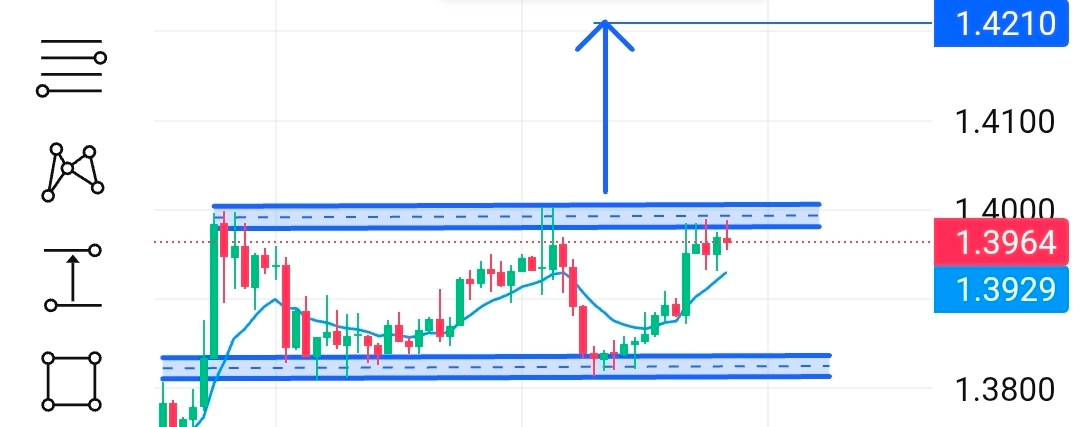
XRP is currently showing strong sideways movement on the **1-hour chart**, trading within a well-defined range. Here is a breakdown of the key levels to watch:
### 📊 The Technical Setup
* **The Resistance Zone:** The price is facing heavy selling pressure around the **$1.4000** mark. This psychological and technical level has capped gains over the last few sessions.
* **The Support Zone:** On the downside, strong buyers are stepping in at the **$1.3800** level. This base has held firm, preventing any deeper correction for now.
* **RSI Check:** The Relative Strength Index (RSI) is sitting near **63**, indicating healthy bullish momentum without being overbought yet.
### 🎯 The "Long" Opportunity
The chart shows a clear **Bullish Rectangle** formation. A decisive hourly candle close above the **$1.4000** resistance could trigger a breakout.
* **Target:** $1.4210 (calculated by the height of the current consolidation range).
* **Confirmation:** Watch for an increase in volume to confirm the breakout strength.
### ⚠️ Risk Management
If the price fails to break the upper resistance and slips below the **$1.3800** support, the bullish thesis is invalidated, and we might see a retest of lower demand zones.
> **Note:** Trading crypto involves high risk. Always wait for a confirmed candle close above resistance before entering a trade. Use stop-losses to protect your capital!
>
**Are you looking to enter at the breakout, or are you waiting for a deeper dip to the
support line?**