$ETH is still in a fragile recovery phase after a major 2026 drawdown. Most analysts currently describe the structure as:
Macro trend: bearish-to-neutral
Short-term trend: consolidation
Volatility state: compression before expansion
Key driver: liquidity + macro risk sentiment
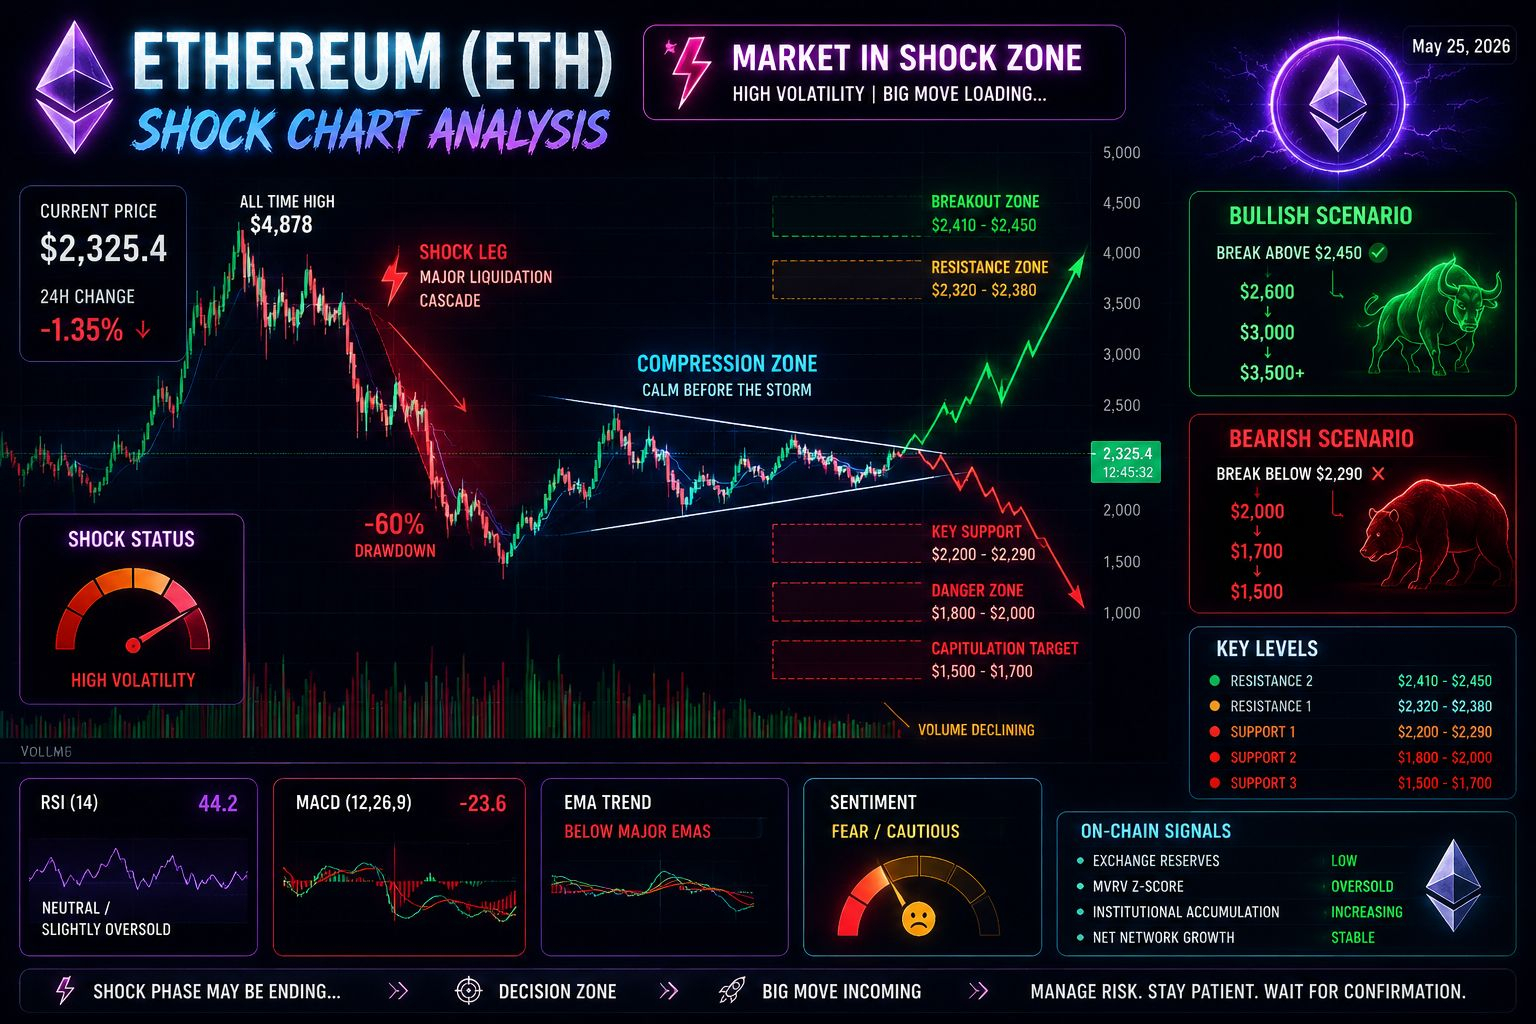
Recent reports place ETH around the $2,200–$2,350 zone, with repeated rejection near resistance. �
Shock Chart Interpretation
In crypto, a “shock chart” usually refers to:
sudden liquidation cascades,
volatility spikes,
support/resistance breakdowns,
or deviation from fair-value metrics.
The current ETH shock structure has 4 major signals:
Liquidation Shock Already Happened
ETH experienced a severe deleveraging phase in early 2026.
Key effects:
~60% retracement from highs
billions in leveraged liquidations
panic selling across exchanges
That initial “shock leg” appears largely complete. �
ETH Is Compressing Near Critical Levels
Traders are closely watching this range:
Level
Importance
$2,410–2,450
breakout trigger
$2,320–2,380
heavy resistance
$2,200–2,290
key support
$1,800–2,000
danger zone
$1,500–1,700
capitulation target if breakdown occurs
Community traders describe current price action as a “wedge compression” setup. �
Reddit +2
A simplified version of the current compression idea:
On-Chain Metrics Suggest Possible Undervaluation
Some bullish analysts point to:
low exchange reserves,
institutional accumulation,
oversold MVRV Z-score,
historically weak sentiment.
One report highlighted MVRV near capitulation territory, which historically aligned with ETH cycle bottoms. �
KuCoin +1
That does not guarantee upside immediately, but it suggests:
panic may be late-stage,
long-term buyers are slowly returning.
Structural Weakness Still Exists
The bearish side remains strong because:
ETH fees are lower,
Layer-2 migration reduced burn pressure,
ETH supply became mildly inflationary at times,
BTC dominance is still high.
Analysts note ETH is underperforming BTC this cycle. �
Technical Momentum Snapshot
Current indicators across several analyses:
Indicator
Reading
RSI
neutral / slightly oversold
MACD
still bearish
Trend EMAs
price below major averages
Volume
declining
Sentiment
cautious / fearful
Bullish Scenario
If ETH breaks above the resistance cluster:
�
Then traders would likely target:
$2.6K first,
then psychological $3K.
This would require:
strong BTC continuation,
ETF/institutional inflows,
macro stability,
higher Ethereum activity.
Bearish Scenario
If support fails:
�
Then:
liquidation pressure could accelerate,
sentiment may flip into another fear cycle.
Several analysts still warn about this possibility. �
Cointelegraph +2
Overall Read
Current ETH “shock chart” conditions suggest:
The largest panic phase may already be behind the market.
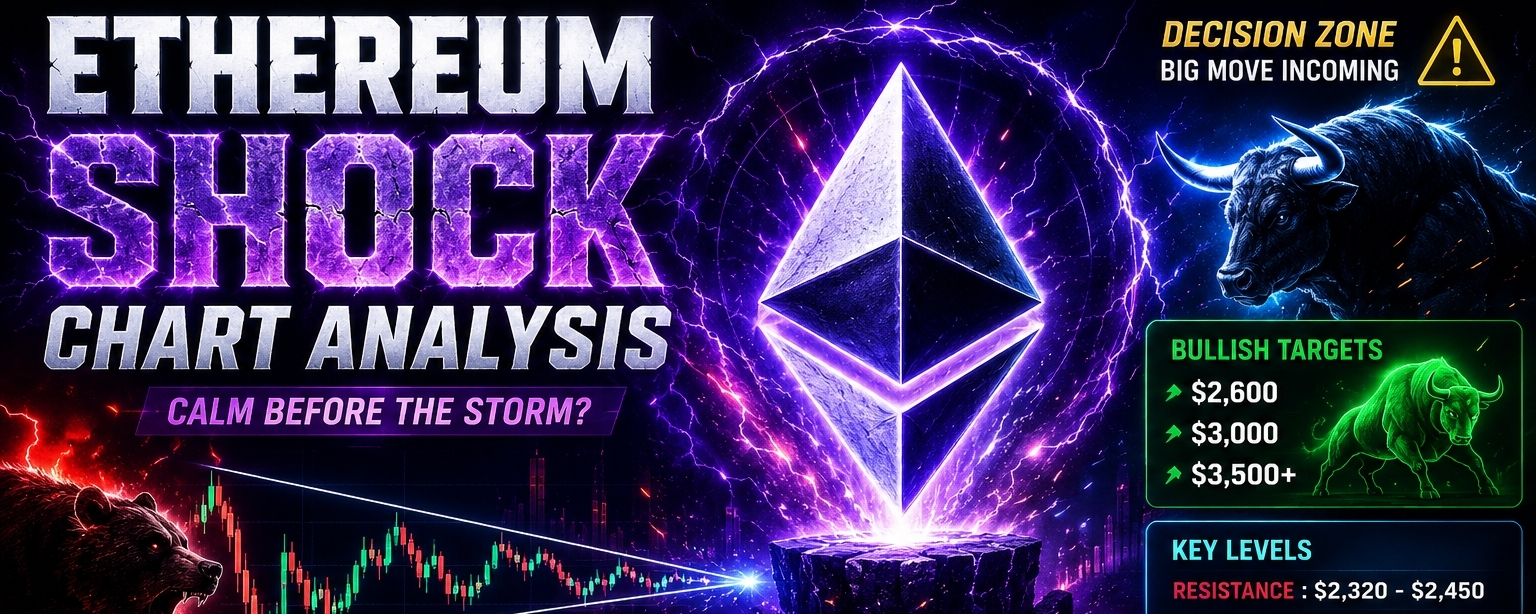
ETH is now in a decision zone.
Price compression means a large move is likely coming soon.
Direction depends heavily on:
Bitcoin dominance,
macro liquidity,
ETF/institutional demand,
Ethereum network activity.
Right now, the market looks more like:
“high volatility consolidation” than a confirmed new bull run.
#ETHETFsApproved #CZ #BTC走势分析 #Write2Earn #Write2Earn!
 ETH2,006.49-0.79%