
The last time whales accumulated at this pace was 2013. Let that sink in.
While crypto Twitter is calling tops and writing obituaries for the bull run, the on-chain data is telling a completely different story. And if you know how to read it, this dip at $78K looks less like a warning and more like a gift.
MVRV Z-Score: The Signal Nobody's Watching
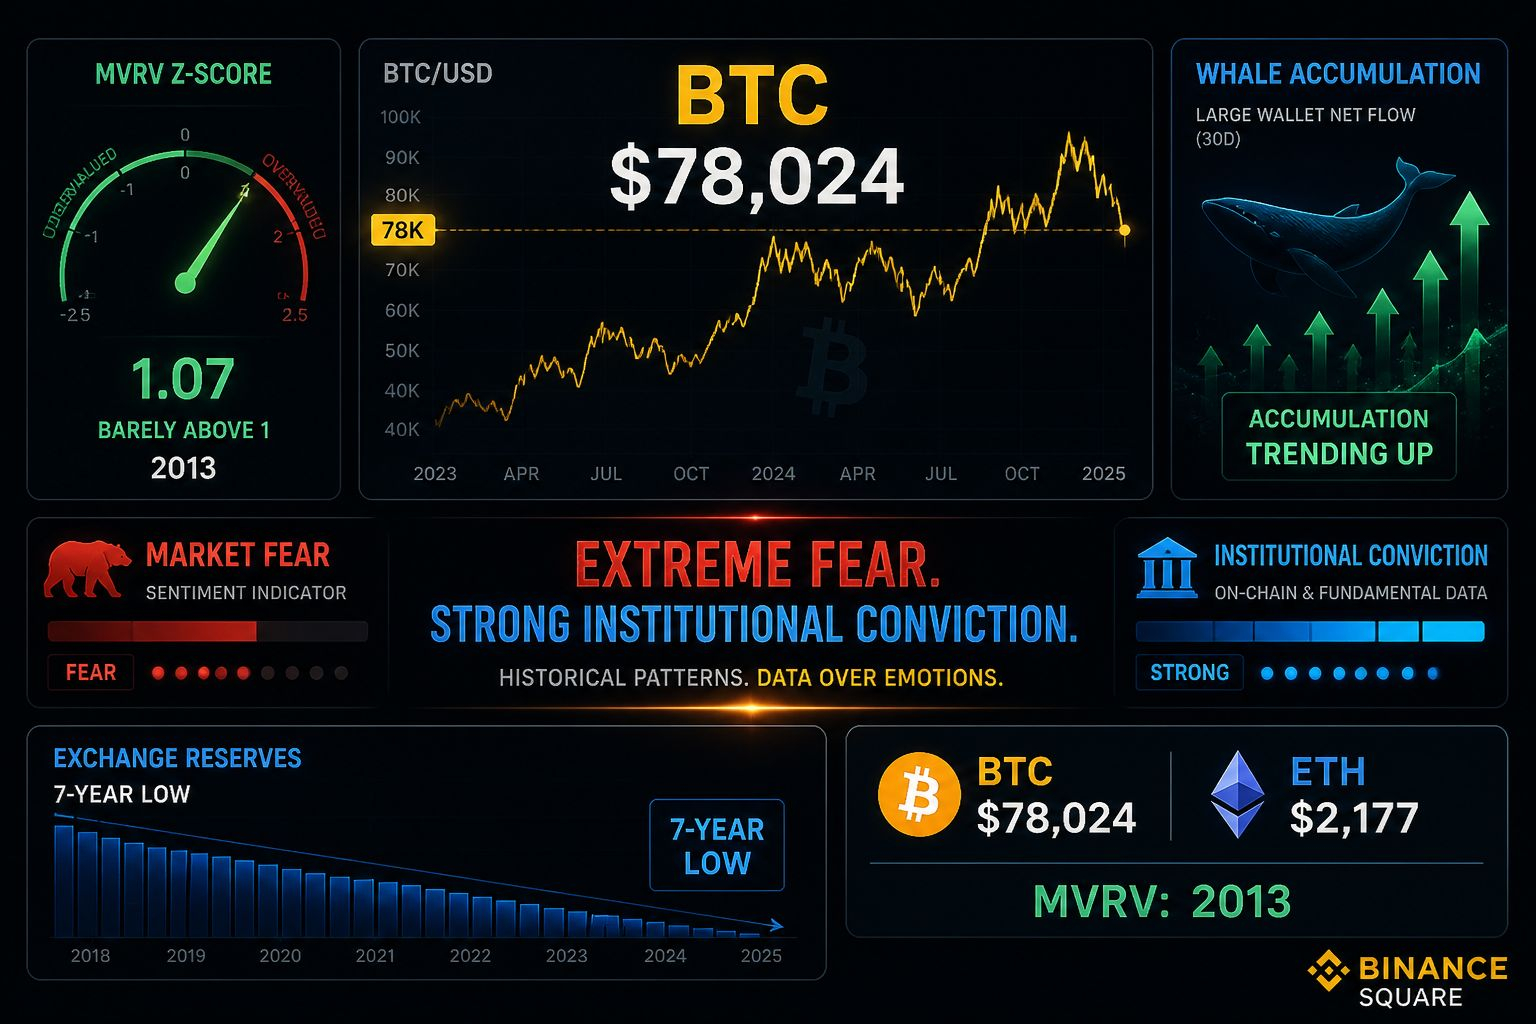
This is the one metric that has called every major cycle top going back to 2013. When it hits 6 or above, you start getting cautious. It peaked at 12 in 2013, 11 in 2017, 7 in 2021.
Right now it's sitting near 1.
One. That's it. The crowd calling this a local top has zero on-chain backing. The most reliable overheating signal in crypto is barely registering and BTC is at $78,024. The "this is the top" narrative is loud but it's empty.
What's Actually Happening Right Now
The $78K print isn't a structural breakdown. It's macro spillover. Crude oil pushed past $100, bond yields repriced hard, and traders started adjusting Fed expectations toward hikes again. That wiped $500 million in crypto longs in a single liquidation cascade, SOL and $XRP both took 5%+ hits alongside BTC. This was a macro rout, not a crypto-specific breakdown.
The CLARITY Act regulatory tailwind is still intact. The on-chain fundamentals haven't moved. What moved is the macro environment, and that's temporary.
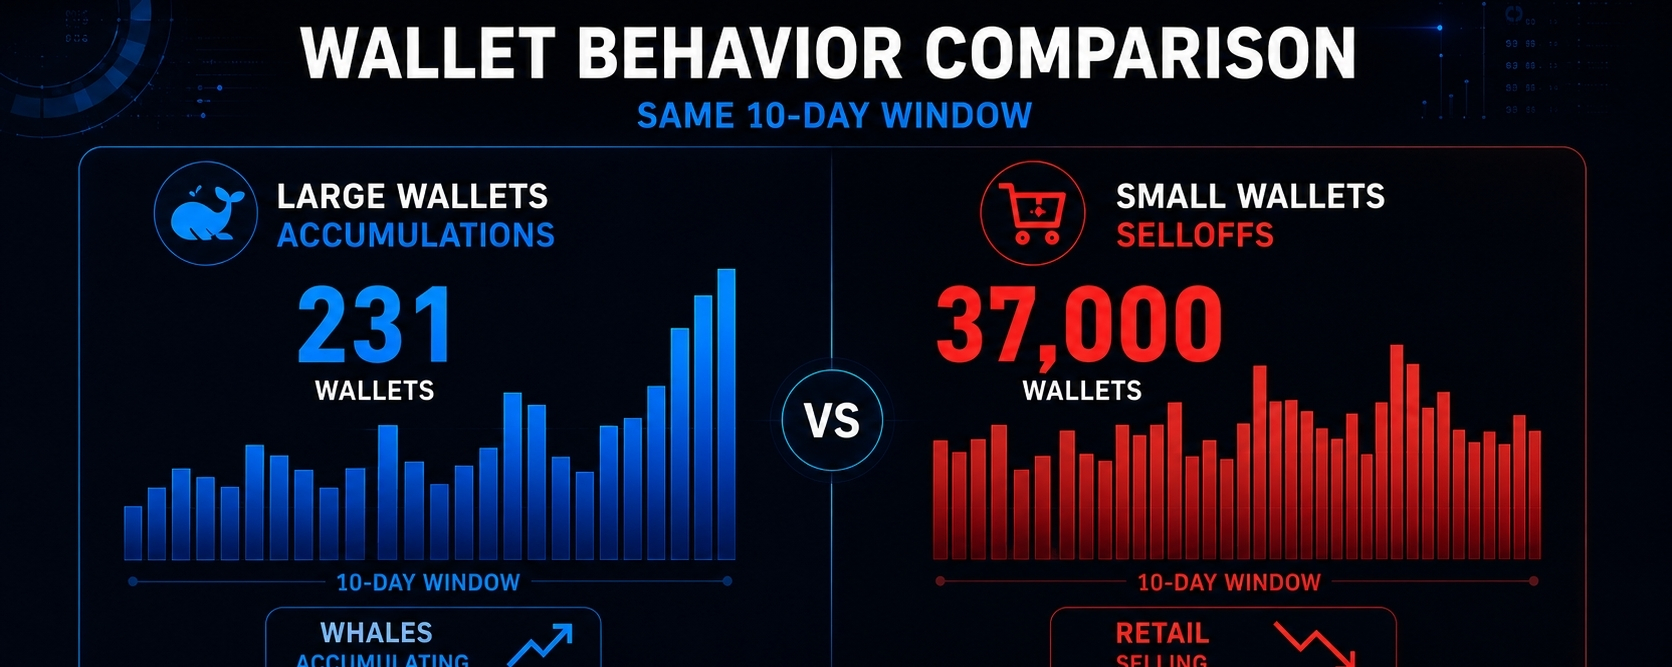
Here's the part that matters most though. While retail traders with under 10 BTC were selling, 231 new wallets crossed the 10 BTC threshold in the last 10 days. That's accumulation. Quiet, steady, and very deliberate.
Exchange reserves just dropped to 2.21 million BTC, a 7-year low. Less BTC on exchanges means less immediate sell pressure. Fam, coins moving off exchanges don't end up there by accident.
The Supply Math That Changes Everything
Bitcoin ETFs are currently absorbing somewhere between 4,500 and 5,000 BTC every single day. Daily mining output is 450 BTC. That's a 10 to 1 demand to supply ratio. Not 2 to 1. Not 3 to 1. Ten to one.
Think about what that means over weeks and months. The available float is getting consumed faster than it can be replenished and exchange reserves are already at multi-year lows. This isn't complicated math. It's just math most people aren't sitting down to do.
Coinbase Institutional and Glassnode put out a joint report recently. 75% of institutional investors rated BTC as undervalued at current levels. 71% of retail investors said the same thing. The sentiment index is sitting in Fear territory while the people actually moving large capital are calling it undervalued.
That divergence right there is the whole story.
The Setup
231 new wallets stacking 10+ BTC while 37,000 small wallets are selling. MVRV near 1 while tops have historically required readings of 6 and above. ETF demand running 10x daily supply. Exchange reserves at a 7-year floor. Whales net bought more in the last 30 days than any month since 2013.
All of this while BTC sits at $78K and the Fear gauge is flashing red.
Nobody rings a bell at the bottom. But the on-chain data does something close to it, and right now it's being pretty loud for anyone paying attention.
ETH is at $2,177 and SOL at $86 getting dragged down by the same macro tide. None of these are broken assets. They're discounted assets in a macro storm that will pass.
The traders who made generational wealth in previous cycles weren't the ones who sold when everyone panicked. They were the ones who quietly read the data, ignored the noise, and kept buying.
The data hasn't changed. The price temporarily has.
DYOR fam.