Looking at the daily chart of Bitcoin, several key technical factors are converging, pointing toward a strong potential for a short-term corrective move:
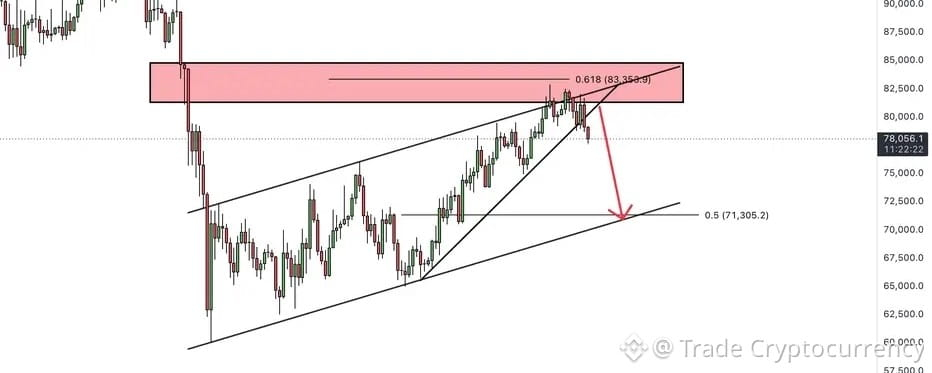
The Ascending Channel & Channel Top: Since the sharp drop in early February, price has been trading within a well-defined Ascending Channel. The recent rally pushed the price right into the upper boundary (Channel Top), which naturally acts as a dynamic take-profit and reversal zone for buyers.

Major Horizontal Resistance Zone : This channel top perfectly coincides with the previous major support-turned-resistance zone between $82,500 and $85,000, where sellers are heavily defending.
Confluence with the Golden Fib Ratio : To make this resistance cluster even stronger, the horizontal supply zone and channel top align perfectly with the 0.618 Fibonacci retracement level at $83,353. The recent long upper wicks (shadows) in this area confirm heavy selling pressure and a textbook rejection.
Break of the Inner Trendline: The steeper, local ascending trendline that was guiding the price since late April has now been broken to the downside. Price is currently trading below it , signaling a loss of bullish momentum and confirming the rejection from the channel top.
Given the perfect confluence of the Channel Top, 0.618 Fib level, and the breakdown of the local trendline, the most probable scenario is a deeper correction toward the main channel’s lower boundary.
What are your thoughts? Will BTC manage to break above the channel top, or are we heading straight to the channel bottom at $71K?
Trade at your own Risk 👍
Best Regards, Trade Cryptocurrency
Stay Tuned for Further Updates.