
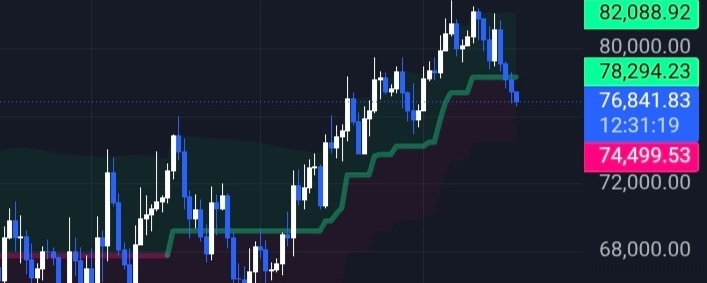
Technical Consolidation and Key Support Levels
$BTC is currently experiencing a crucial consolidation phase, trading around $77,000 after a slight daily decline of between 1.15% and 1.5%. This minor pullback follows a strong rally earlier this month, during which the asset temporarily regained momentum above $80,000 and reached a three-month high near $83,000. The price now stands at a significant structural crossroads, testing key technical and psychological support levels near $76,900. Failure to hold this level could expose the asset to hedging by speculators using negative gamma, potentially triggering a deeper retest towards $75,000. Conversely, the 200-day simple moving average, hovering near $82,595, remains the primary resistance level that buyers must decisively break through to ignite a sustained expansion of the trend. Despite this short-term volatility, Bitcoin's market dominance remains strong at over 58%, demonstrating that capital is still safely invested in the benchmark asset rather than flowing heavily into highly volatile altcoins.
Regulatory Catalysts and Macroeconomic Reality
The current market direction is closely tied to key legal and political milestones, most notably the progress made by the Clarity Act in the US Senate. This anticipated legislation has generated a wave of structural optimism, as institutional investors study its provisions in anticipation of clearer controls regarding asset classification and institutional access. While regulatory progress has not entirely shielded the asset from its immediate price decline, it is viewed as a significant positive for long-term capital flows. Meanwhile, broader macroeconomic challenges keep the trading environment highly sensitive. Renewed geopolitical rhetoric surrounding the stalled US-Iran negotiations has further heightened risk aversion in global markets. This geopolitical tension, coupled with rising global interest rates and anticipated tax guidance on cryptocurrency transactions, has dampened the short-term enthusiasm of retail investors. The generally subdued market reaction reflects a measured, wait-and-see approach to macroeconomics, rather than panic selling.
Blockchain Trading Volume and Participant Divergence
A closer look at blockchain data reveals an interesting structural divide developing among different categories of market participants. The “whale-retail” divergence has officially fallen to its lowest level since January 2024, the period that saw the launch of US spot ETFs. This specific blockchain data suggests that while bullish retail traders are buying on dips, believing a structural floor is forming, larger “smart money” entities are actively reducing their risk exposure following the recent surge to $83,000. Furthermore, previously inactive cryptocurrency wallets have begun moving significant amounts of coins, adding a layer of local uncertainty to the distribution. Daily trading volumes remain healthy, averaging between $57 billion and $65 billion, indicating a proactive repositioning of wallets across lending pools and spot trading platforms, rather than market capitulation. For cautious investors, navigating this current situation means ignoring the noise of the daily Fear & Greed Index—currently at a cautious level of 28 in the "fear" zone—and following the underlying whale accumulation trends.