
Introduction:
In 2026 the crypto community learned to watch for fast crime pumps. RAVE. SIREN. PIPPIN. Tokens that spike thousands of percent in days then collapse 95% in hours. The pattern became recognizable. ZachXBT flagged it. Exchanges opened investigations. Retail started paying attention.
But while everyone was watching for the fast pump — a slower and more dangerous version was running in plain sight.
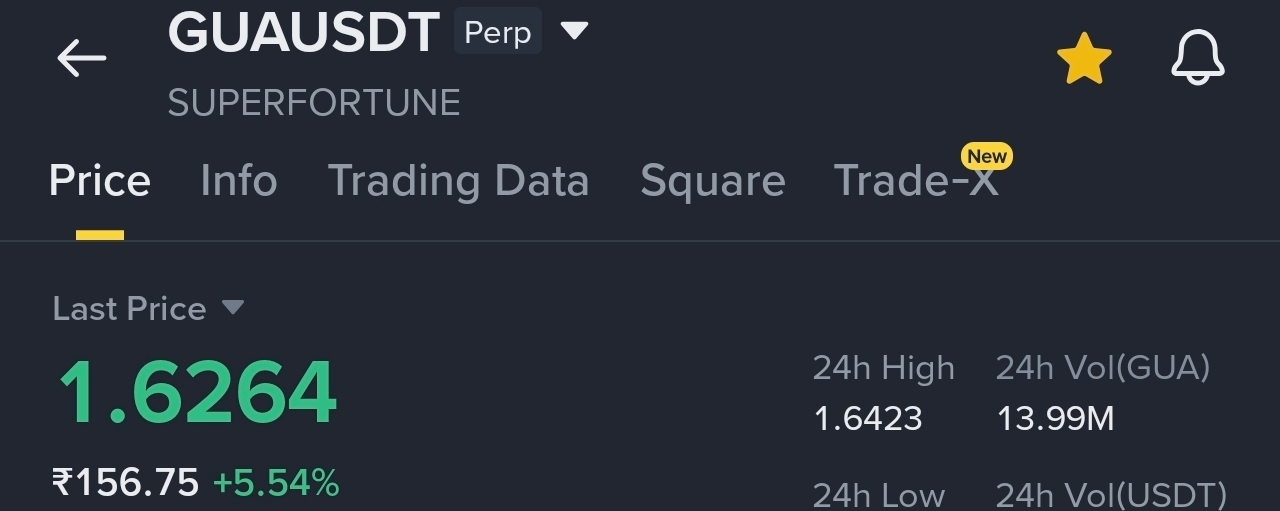
SuperFortune GUA. 13 consecutive green weekly candles. 1,300% from $0.11 to $1.68. And almost nobody noticed until it was too late.
This article breaks down every red flag hidden in the public data.
Section 1 — The Volume Problem:
A token with $1.52 billion fully diluted valuation. 13 weeks of straight green candles. 1,300% pumped. Daily volume never exceeded $10 million in 50 days.
This is the first and most important signal. Volume is the heartbeat of a market. When price rises dramatically but volume stays suppressed — it means real buyers are not driving the move. A handful of wallets controlling 90% of supply can walk price up with minimal transactions when there is almost no sell side to absorb.
When RAVE pumped to $6 billion market cap — daily futures volume hit $2.5 billion. Organic markets create organic volume. GUA pumped 1,300% on $8 million daily volume. The math does not work unless supply is being artificially controlled.
Section 2 — The Concentration Evidence:
Gini distribution score — 0.9992. A perfect score of 1.0000 represents total monopoly. 0.9992 means as close to complete insider control as the mathematics allow.
Top 5 wallets — 79% of total supply.
Top 10 wallets — 90% of total supply.
Circulating supply — only 125 million out of 1 billion total. 12.5% float.
This is the identical fingerprint of every confirmed crime pump in 2025 and 2026. RAVE had 90% insider concentration. SIREN had 88.5% controlled by 52 wallets belonging to the same entity. GUA has 90% in top 10 wallets.
Section 3 — The Hidden Supply Discrepancy:
This is the most alarming finding.
CoinMarketCap lists 125 million GUA as circulating supply. But the token unlock tab on the same platform shows an unlocked market cap of $370 million. At the current price of approximately $1.53 per token — $370 million divided by $1.53 implies approximately 242 million tokens are already unlocked.
That is 117 million tokens unlocked but not reflected in the official circulating supply number.
These tokens exist. They are unlocked. They sit in insider wallets invisible to retail investors who rely on CoinMarketCap circulating supply to assess how tight or loose the supply actually is.
The apparent scarcity driving price higher is partially manufactured.
Section 4 — The Whale Tracker Evidence:
Binance whale tracker data on GUA reveals the complete picture.
116 whales are long from an average entry price of 0.6208 USDT. Their current positions total $25.53 million with unrealized profit of $15.2 million. 86.2% of these whale long positions are profitable.
38 whales are short from an average entry of 1.0281 USDT. Their positions total $839,000 with unrealized losses of $277,910. Only 42.1% of short positions are profitable.
The notional long to short ratio is 3,042%.
This data explains everything. Whales accumulated between $0.12 and $0.62 before the public price discovery. They have been sitting on massive unrealized profits while the slow pump walked price from their entry zones to current levels. The repeated short squeezes at $1.60 and $1.68 were not random market volatility. They were deliberate stops hunts by wallets that knew exactly where retail short stop losses were placed.
Section 5 — The Unlock Time Bomb:
Every 27th of every month — 32 million new GUA tokens unlock.
The full unlock schedule by March 2029:
General Airdrop — 50 million tokens.
Team — 113.79 million tokens.
Manta staker rewards — 50 million tokens.
Ecosystem — 204.25 million tokens.
Treasury — 400 million tokens.
CEX Liquidity — 70 million tokens.
Other allocations — additional millions.
Total unlocked by 2029 — 928 million tokens out of 1 billion total supply.
A market that currently cannot sustain $10 million in daily volume will face 928 million tokens of supply over the next three years. Every unlock event is potential sell pressure from insiders whose average cost basis is $0.62 or below while current price is $1.62.
Section 6 — The Slow Pump vs Fast Pump Distinction:
Fast crime pumps are visible. RAVE spiked 10,800% in days. Volume exploded to $2.5 billion. Exchanges opened investigations. The community talked about nothing else.
Slow crime pumps are invisible by design. Thirteen weeks of one green candle per week does not trigger alerts. No explosive volume means no investigators. No red candles means no panic selling from holders. Retail gradually notices the chart is going up and buys in near the top while insiders who entered at $0.12 prepare their exit.
The psychology is different but the outcome is identical. Insiders profit. Retail absorbs the eventual distribution.
Conclusion:
Every data point in this article is publicly available. The Gini score is on the holder distribution page. The unlock schedule is in the token unlocks tab on CoinMarketCap. The whale data is in the Binance trading data section. The volume figures are on every chart platform.
The information exists. Most people do not know where to look or what to look for.
This is not financial advice. It is a framework for reading what the data is actually saying before making any decision.
Check BubbleMaps before every entry. Check the unlock schedule before every entry. Check the Gini score before every entry.
The slow pump is more dangerous than the fast pump precis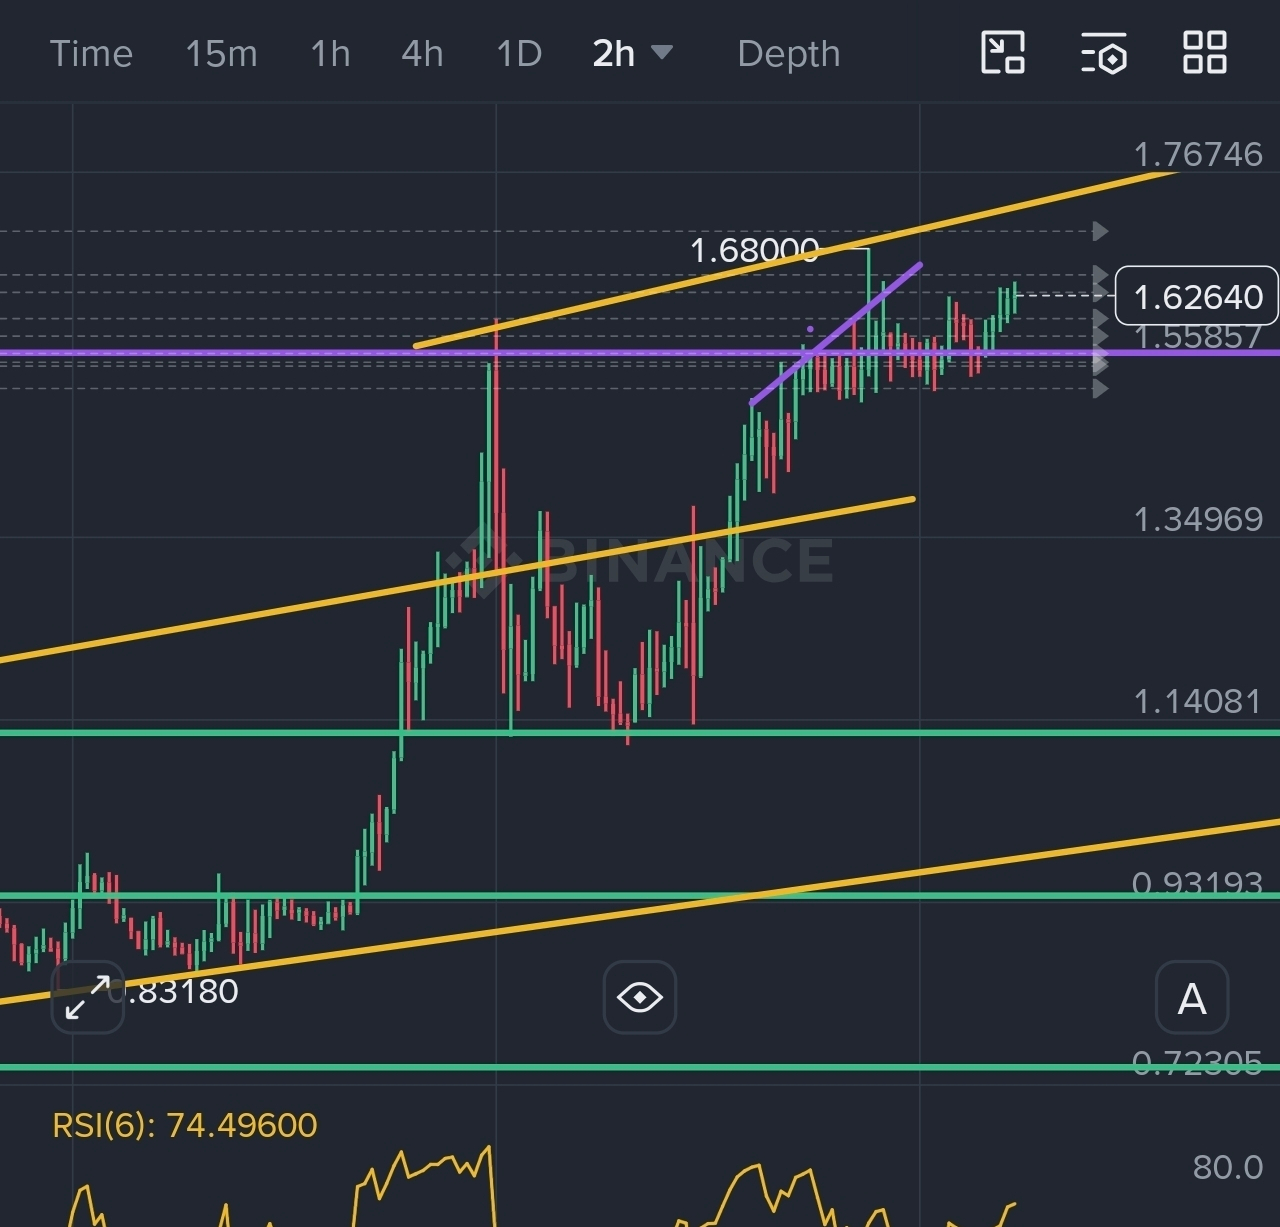 ely because it feels safe while it is happening.