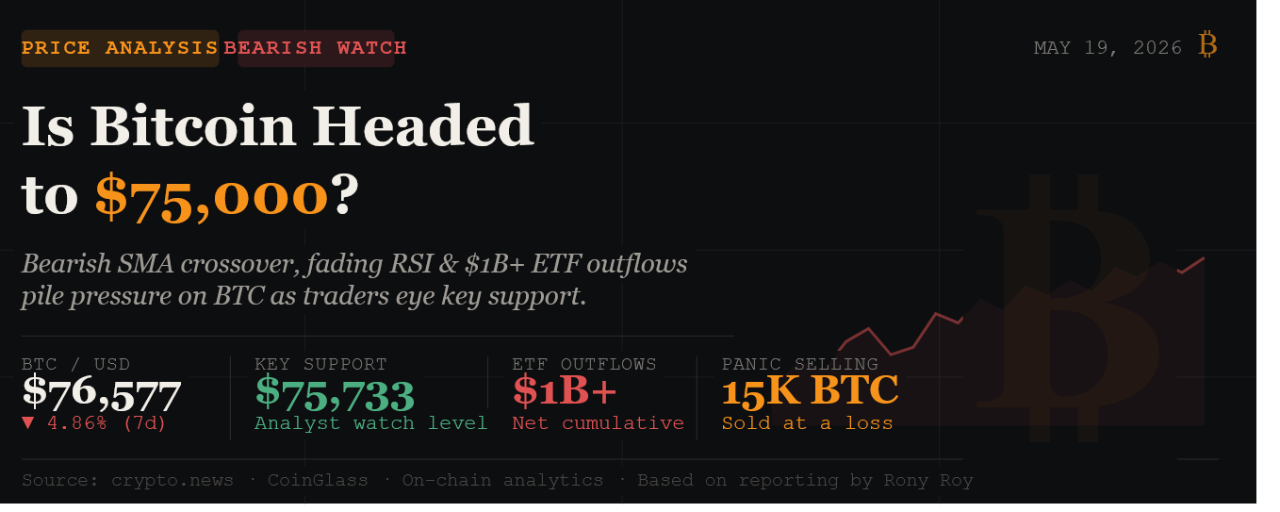

A bearish SMA crossover, fading RSI momentum, and over $1 billion in ETF outflows are piling pressure on BTC — and traders are watching the $75,000 support zone closely.
Key Takeaways
Bitcoin slipped toward $76,000 as a bearish 20/50-day SMA crossover and declining RSI increase downside pressure.
Spot Bitcoin ETFs recorded more than $1 billion in net outflows, signaling a notable cooling of institutional demand.
Short-term holders sold over 15,000 BTC at a loss, pointing to accelerating panic selling near current levels.
CoinGlass liquidation data shows dense leverage clusters around $75,500, a zone that could act as a magnet for further selling.
A CME futures gap near $79,200 could trigger a short-term bounce before bears resume control.
Bitcoin continued trading under significant pressure on May 19, hovering around $76,700 after a failed attempt to hold above $77,000 earlier in the session. The asset has shed considerable momentum since its recent rejection near $83,000, where heavily leveraged long positions had concentrated and were subsequently liquidated.
Multiple converging forces — technical deterioration, institutional outflows, on-chain selling, and macro headwinds — have created a fragile environment for the world's largest cryptocurrency, raising serious questions about whether $75,000 is the next stop.
Geopolitics and Macro: The Spark That Lit the Fuse
The latest sell-off was accelerated by renewed geopolitical tension surrounding Iran. Reports that U.S. and Israeli officials discussed potential military action against Tehran sent a wave of risk aversion through global markets, and Bitcoin — as one of the most liquid assets that trades around the clock — bore the brunt of panic selling over the weekend when traditional markets were closed.
At the macro level, elevated crude oil prices have revived inflation concerns, dimming expectations for near-term Federal Reserve rate cuts. Investors are now closely watching this week's FOMC minutes, upcoming remarks from Fed Governor Christopher Waller, and Thursday's weekly jobless claims data. A resilient labor market would likely reinforce the Fed's "higher for longer" stance, which has historically weighed on non-yielding assets like Bitcoin.
Institutional Retreat: ETFs Turn From Tailwind to Headwind
One of the most consequential developments in this correction has been the reversal of institutional flows. U.S.-listed spot Bitcoin ETFs, which served as a powerful source of structural buying demand during the early-year rally, have now recorded more than $1 billion in cumulative net outflows. This removes a key price stabilizer and transforms a former tailwind into a meaningful headwind.
On-chain data reinforces the pessimism. Analysts tracked over 15,000 BTC recently sold by short-term holders at prices below their cost basis — a classic sign that capitulation is beginning to take hold. When even recent buyers are selling at a loss, it often signals that sentiment has deteriorated significantly from peak levels.
The Technical Picture: Why Traders Are Nervous
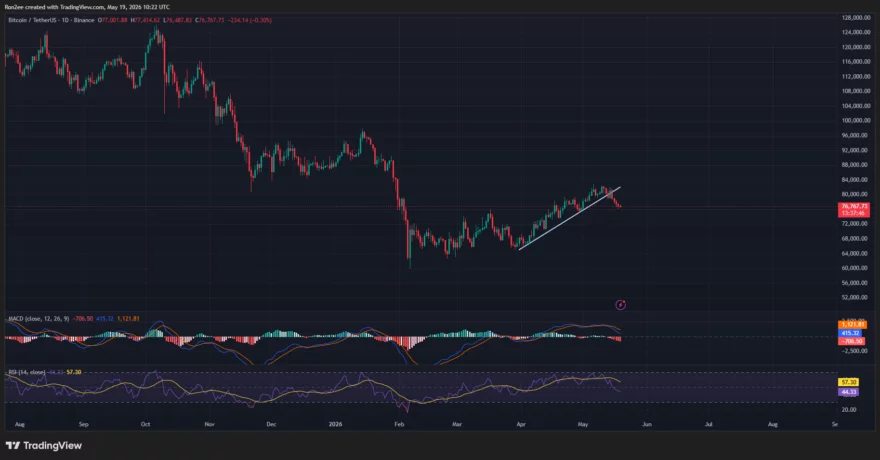
On the daily chart, Bitcoin has broken below an ascending trendline that guided prices higher throughout April, dismantling the pattern of higher lows that bulls had defended for weeks. Two additional technical developments are drawing trader attention.
First, the 20-day simple moving average is approaching a bearish crossover below the 50-day SMA. Unlike short-term price swings, moving average crossovers smooth out noise and reflect genuine shifts in trend momentum. Traders watching this formation see it as an early warning that sellers are gaining structural control.
Second, the MACD has crossed deeper into negative territory. The MACD line remains below the signal line while the histogram continues printing expanding red bars — a configuration that typically indicates downside momentum is strengthening rather than stabilizing. The RSI has also turned sharply lower after approaching overbought conditions earlier this month. Critically, the RSI has not yet reached deeply oversold territory, suggesting the market may have room for additional downside before a meaningful relief bounce becomes likely.
Key Price Levels to Watch
Level Type Significance $84,569 Resistance Major bull recovery target $79,200 CME Gap Short-term bounce target; gaps tend to fill $78,258 Resistance Immediate barrier; must reclaim to shift bias $75,733 Support Key near-term defense zone $75,500 Liquidity Zone Dense long liquidation cluster (CoinGlass) $66,898 Major Support Deeper correction target if $75K breaks
Liquidation Dynamics: The Leverage Trap
Derivatives positioning adds another layer of complexity. CoinGlass liquidation heatmap data reveals a dense cluster of leveraged long positions concentrated around the $75,500 area — directly aligned with Bitcoin's broader historical support band between $74,000 and $75,000. When large pockets of leverage accumulate near key technical levels, price tends to gravitate toward those zones as stop-loss orders and forced liquidations cascade automatically.
A substantial portion of the long leverage that had built up near $83,000 has already been flushed. If Bitcoin loses current support decisively, forced liquidations could mechanically accelerate the move toward that $75,500 pocket, amplifying what might otherwise be a modest organic decline.
The Bull Case: A Temporary Bounce Before the Next Move?
Not all analysts are positioned for an immediate breakdown. Analyst Ted Pillows noted that Bitcoin had touched the $75,000–$76,000 support zone and pointed to the CME futures gap sitting near $79,200 as a probable near-term target for a rebound. Bitcoin has historically shown a strong tendency to revisit unfilled CME gaps.
"BTC tapped the $75,000–$76,000 support zone and is now bouncing back. There's a CME gap at $79,200 which might get filled next." — Ted Pillows, Crypto Analyst
Analyst Ali Martinez similarly outlined a scenario where Bitcoin could attempt a recovery toward $78,258 before the broader trend reasserts itself. For longer-term observers, Martinez's deeper support near $66,898 remains a critical line in the sand if the current defense fails.
Outlook: Bears Hold the Near-Term Edge
Taken together, the weight of evidence leans bearish in the near term. Technical structure is deteriorating, institutional positioning has reversed, on-chain data reflects accelerating selling pressure, and macro conditions remain unfavorable for risk assets. Altcoins have largely underperformed Bitcoin throughout this correction, signaling that broader speculative appetite within the crypto sector is also fading.
If Bitcoin cannot reclaim the $78,258 resistance identified by Martinez, bears are likely to continue targeting the $75,000 zone. A confirmed break below that level could expose the asset to a deeper correction toward $66,898 — a level that many traders may view as the next meaningful opportunity to reassess positioning.
The short-term path, however, remains uncertain. A CME gap fill near $79,200 could precede any such move, offering a brief window of relief before larger macro and technical forces ultimately determine Bitcoin's next major directional leg.
Disclosure: This article is based on public reporting and is for informational purposes only. It does not constitute investment advice. Always conduct your own research before making financial decisions.